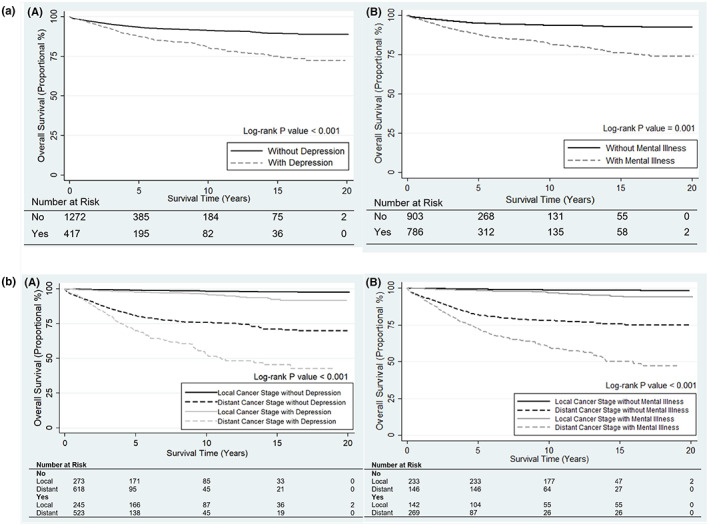
FIGURE 2.

(a) Kaplan–Meier survival curves for ovarian cancer survivors with/without depression (A) and Any mental illness (B) adjusting for baseline BMI, Baseline CCI and age at Diagnosis. (b) Kaplan–Meier survival curves for ovarian cancer survivors with/without depression alone (A) and Any mental illness (B), Stratified by cancer stage, adjusting for baseline BMI, Baseline CCI and age at diagnosis. BMI, body mass index; CCI, Charlson comorbidity index.
