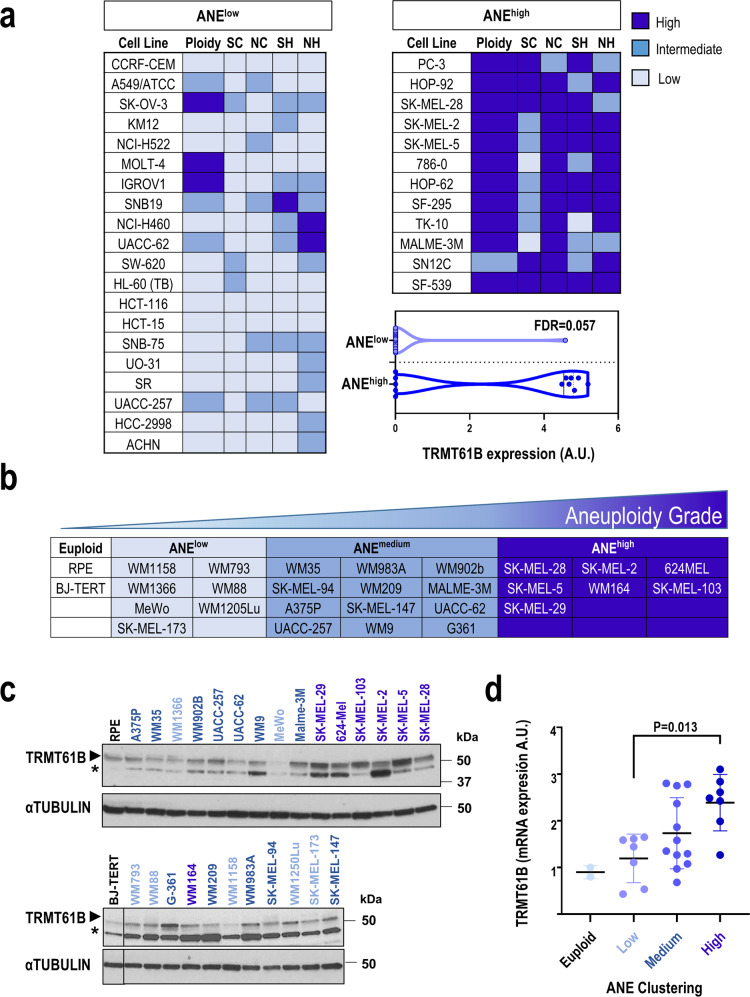
Fig. 1. TRMT61B protein expression positively correlates with aneuploidy levels in human cell lines.
a Following bioinformatics analysis, tumor cell lines included in the NCI-60 panel were grouped into 3 clusters according to different karyotypic features (SC, SH, NC, NH, and ploidy) ranging from low (ANElow) to high (ANEhigh) aneuploidy levels. Cell lines belonging to the most extreme groups in terms of aneuploidy levels are listed. Differential protein expression analysis in cell lines included in these 2 clusters allowed us to identify the TRMT61B gene, a mitochondrial RNA methyltransferase, whose protein expression levels were upregulated in ANEhigh vs. ANElow (FDR = 0.057). SC: Structural Complexity; SH: Structural Heterogeneity; NC: Numerical Complexity; NH: Numerical Heterogeneity. b A collection of 26 human melanoma cell lines and 2 euploid controls were karyotypically characterized for some of the foregoing karyotypic parameters (SC, NC, and ploidy), divided in 4 clusters with null (euploid group) or increased rate of aneuploidy (ANEhigh, ANEmedium, and ANElow). c TRMT61B expression was analyzed by western blot for each of the cell lines in three independent experiments. αTUBULIN was used as loading control for the normalization of TRMT61B protein expression. One representative western blot is shown. d As shown in the dotplot, ANEhigh shows statistically significant upregulation of TRMT61B protein expression compared to ANElow group. Triplicates were considered in the quantification analysis. Error bars represent standard error. *P < 0.05; **0.001 < P < 0.01; ***P < 0.001 (Student’s t-test; unpaired, 2-tailed). One-way ANOVA for multiple comparisons was used to determine statistically significant differences. Asterisks indicate non-specific bands. Lighter to darker blue color code indicates lower to higher aneuploidy grades.

