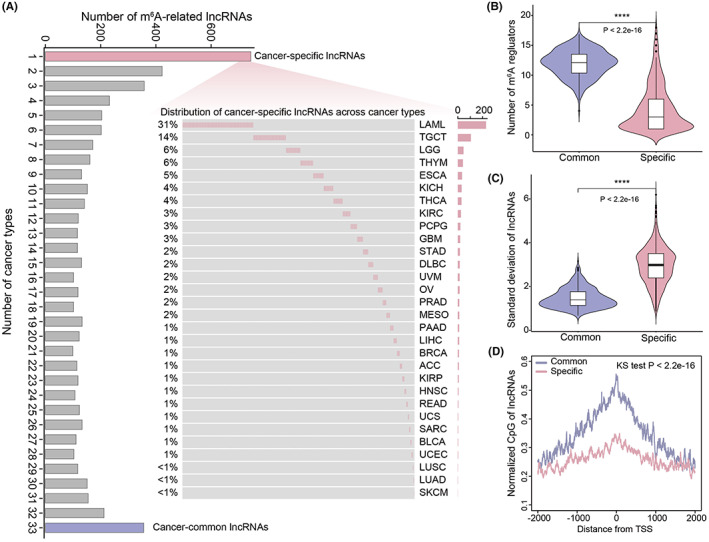
FIGURE 3.

Characterization of cancer‐specific and cancer‐common lncRNAs. (A) Distribution of m6A‐related lncRNAs across cancer types. Red denoted m6A‐related lncRNAs presented in individual tumors as cancer‐specific, blue denoted m6A‐related lncRNAs occurred across all human tumors as cancer‐common. The waterfall plot shows the distribution of cancer‐specific lncRNAs across cancer types. (B) The comparison of the number of related m6A regulators between cancer‐common and cancer‐specific lncRNAs. (C) The comparison of the expression deviation between cancer‐common and cancer‐specific lncRNAs. (D) Distributions of normalized CpG around the TSSs for cancer‐common and cancer‐specific lncRNAs.
