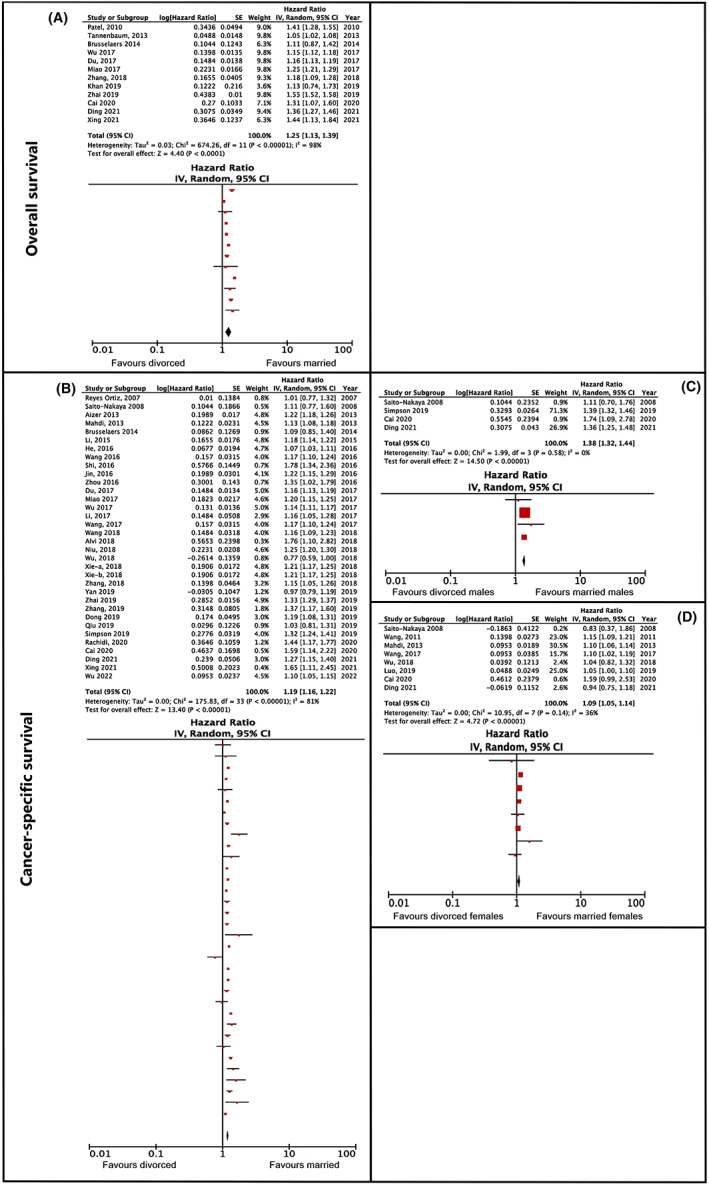
FIGURE 5.

Overall and cancer‐specific survival hazard ratios comparing divorced and married cancer patients. (A) Pertains to overall survival, (B–D) pertain to cancer‐specific survival. (A) Shows the main analysis, without further subgroup analyses. (B) Shows the main analysis, while (C, D) represent the results of subanalyses by gender, for males and females, respectively.
