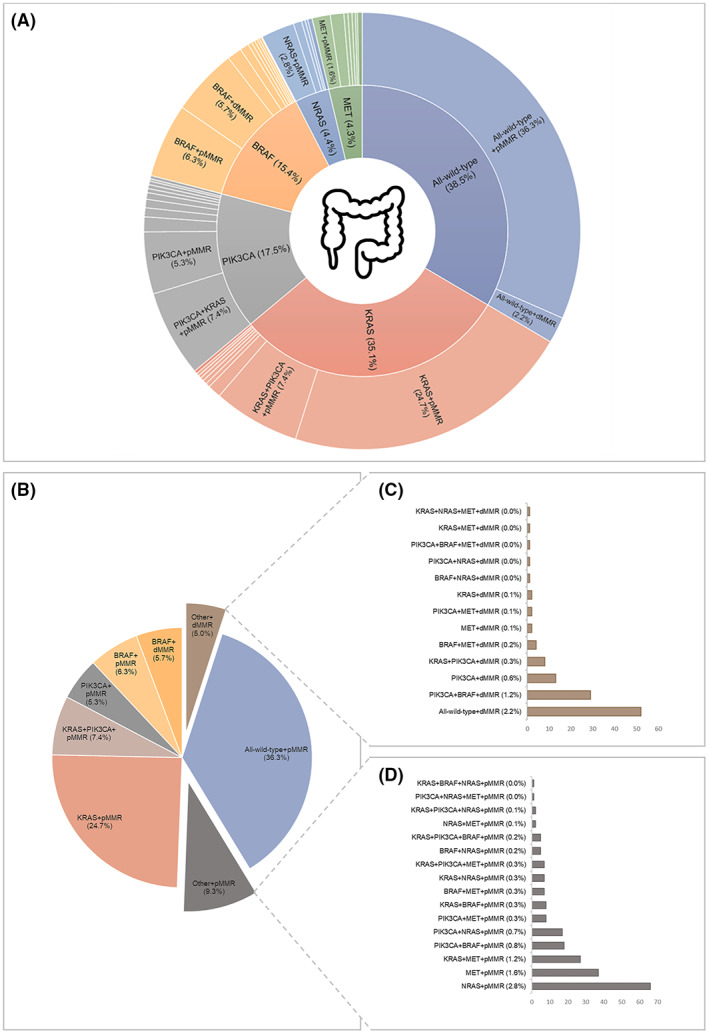
FIGURE 2.

Mutation frequencies and established mutational subgroups of 2344 CRC patients within the Netherlands Cohort Study (NLCS, 1986–2006). (A) Multi‐layered pie chart showing the distribution and frequencies of genetic alterations in KRAS, PIK3CA, BRAF, NRAS, and MET, as well as single‐, double‐, and triple‐mutations in combination with MMR status. The inner circle shows the total mutation frequencies of KRAS, PIK3CA, BRAF, NRAS, and MET. The outer circle shows single‐ double‐ and triple‐ mutations which together contribute to the total mutation frequency, in combination with MMR status. Mutations with a frequency ≤1.2% are not shown. Note: Percentages do not add up to 100% because there is some degree of overlap between mutational groups (e.g., KRAS + PIK3CA). Image colon: Flaticon.com. (B) Pie chart showing the distribution and frequencies of the eight established mutational subgroups: All‐wild‐type + pMMR, KRAS mut + pMMR, KRAS mut + PIK3CA mut + pMMR, PIK3CA mut + pMMR, BRAF mut + pMMR, BRAF mut + dMMR, other+pMMR, and other + dMMR. (C) Histogram showing the distributions and frequencies of combinations of markers (mutational status and MMR status) that together make up the other + dMMR subgroup. (D) Histogram showing the distribution and frequencies of combinations of markers (i.e., mutational status and MMR status) that together make up the other + pMMR subgroup.
