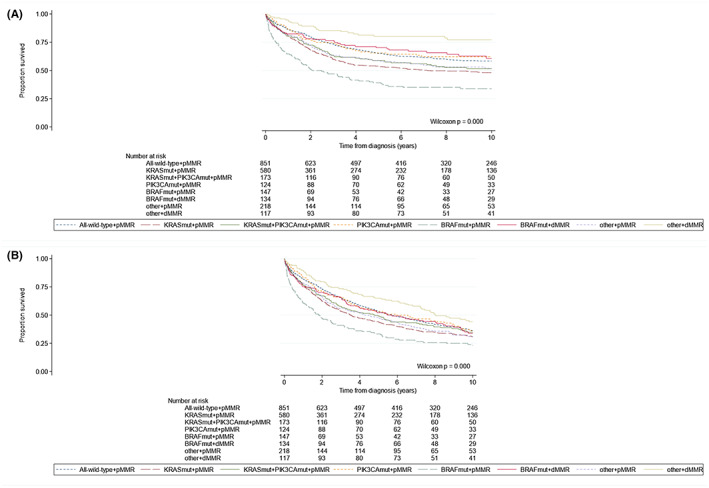
FIGURE 3.

Kaplan–Meier curves according to mutational subgroups (i.e., all‐wild‐type + pMMR, KRAS mut + pMMR, KRAS mut + PIK3CA mut + pMMR, PIK3CA mut + pMMR, BRAF mut + pMMR, BRAF mut + dMMR, other+pMMR, and other+dMMR) in colorectal cancer patients within the Netherlands Cohort Study (NLCS, 1986–2006), showing (A) CRC‐specific survival (median survival times: KRAS mut + pMMR, 7.16 years and BRAF mut + pMMR, 2.48 years) and (B) overall survival (median survival times: All‐wild‐type + pMMR, 5.73 years; KRAS mut + pMMR, 3.49 years; KRAS mut + PIK3CA mut + pMMR, 4.79 years; PIK3CA mut + pMMR, 5.91 years; BRAF mut + pMMR, 1.83 years; BRAF mut + dMMR, 5.46 years; other + pMMR, 4.25 years; other + dMMR, 8.04 years).
