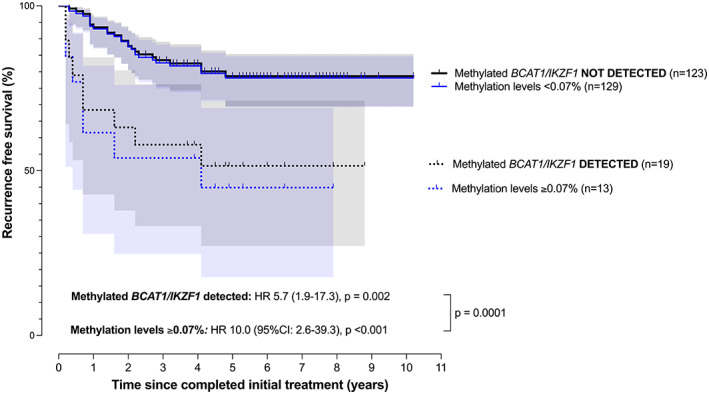
FIGURE 2.

Recurrence free survival analysis stratified by detection of methylated BCAT1/IKZF1 following completion of initial treatment (time 0). HR: hazard ratio. Survival‐curves are based on detection of methylated BCAT1 and/or IKZF1 (black lines; 95% CI band in gray shading) and for those with methylation levels of 0.07% or more (blue lines; 95% CI band in light blue shading).
