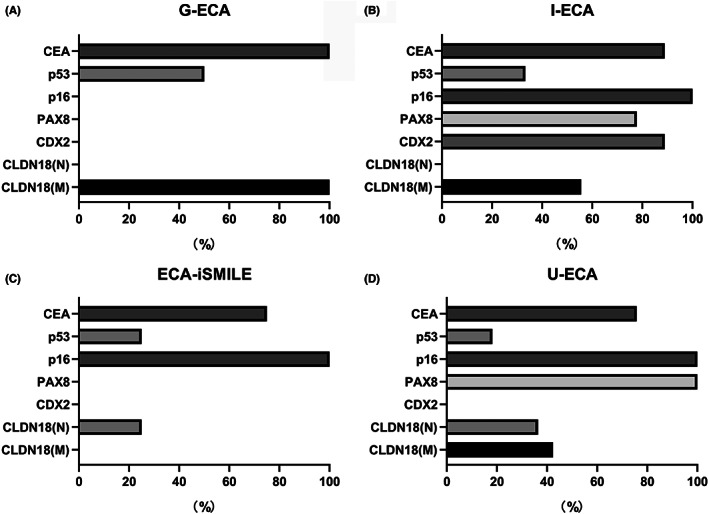
FIGURE 4.

Expression of immunohistochemical markers in different ECA subtypes. Each graph shows the positive or aberrant expression rates of CDX2, PAX8, p16, p53, CEA, CLDN18 (M), and CLDN18 (N). (A) Gastric‐type ECA (n = 8). (B) Intestinal‐type ECA (n = 9). (C) iSMILE‐type ECA (n = 8). (D) Usual‐type ECA (n = 33). ECA, endocervical adenocarcinoma.
