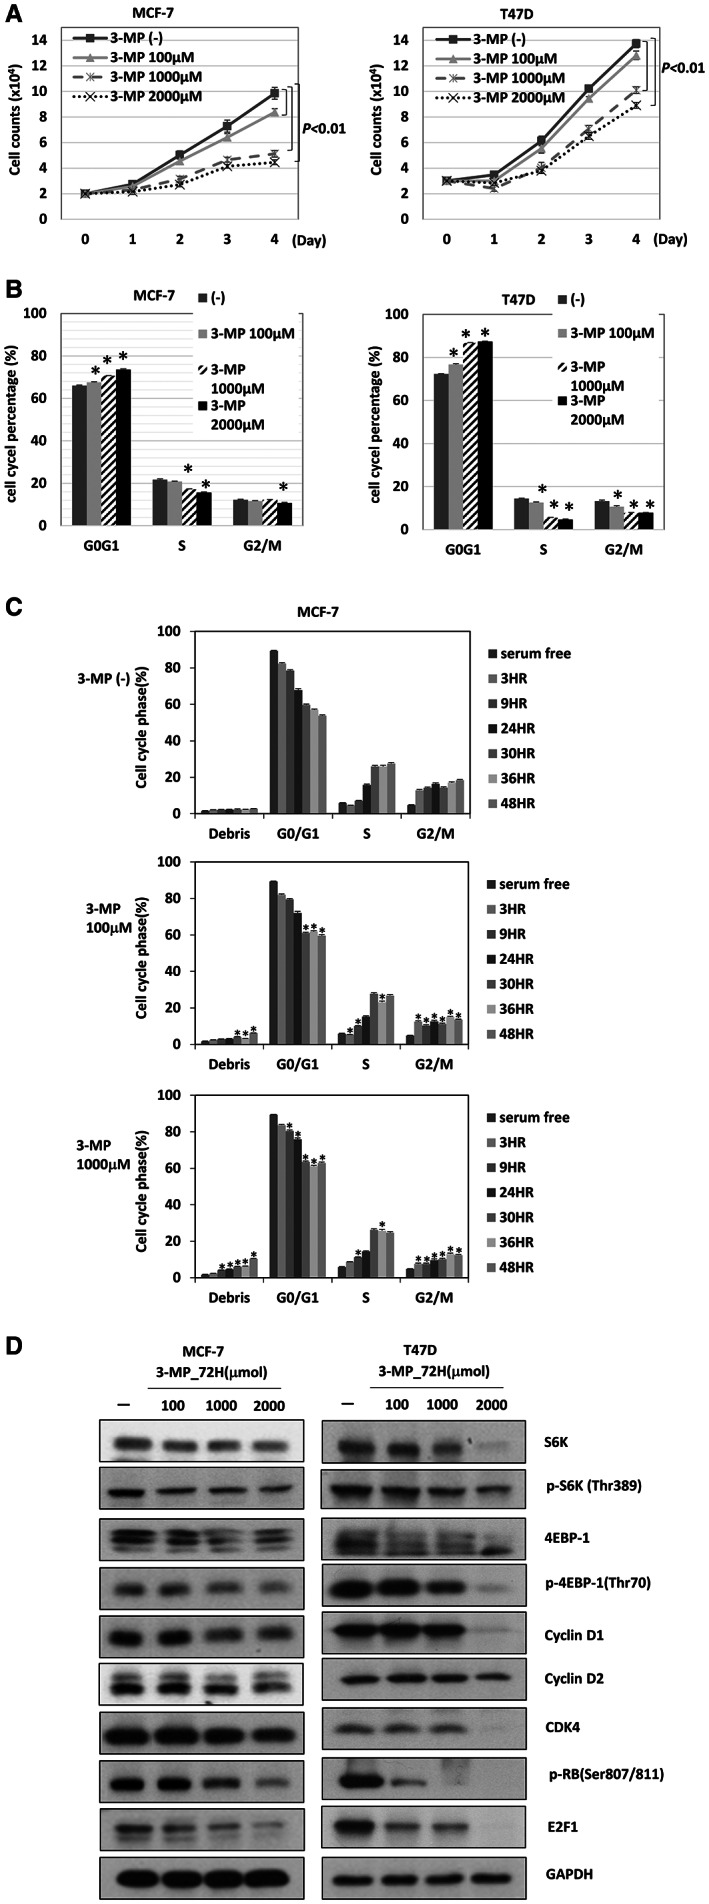
FIGURE 5.

The effect of PEPCK inhibitor, 3‐MP, in ER+ breast cancer. (A) The cell count of MCF‐7 (left) and T47D (right) cells treated with various dose of 3‐MP for 4 days. (B) The cell cycle analysis of MCF‐7 (left) and T47D (right) treated with 3‐MP for 72 h. *p = 0.03. (C) The transition of cell cycle of MCF‐7 cells treated with 3‐MP for indicated dose and duration. *p = 0.03. (D) The expression of downstream signals of mTORC1 and cell cycle associated molecules in MCF‐7 (left) and T47D (right) cells treated with different doses of 3‐MP for 72 h.
