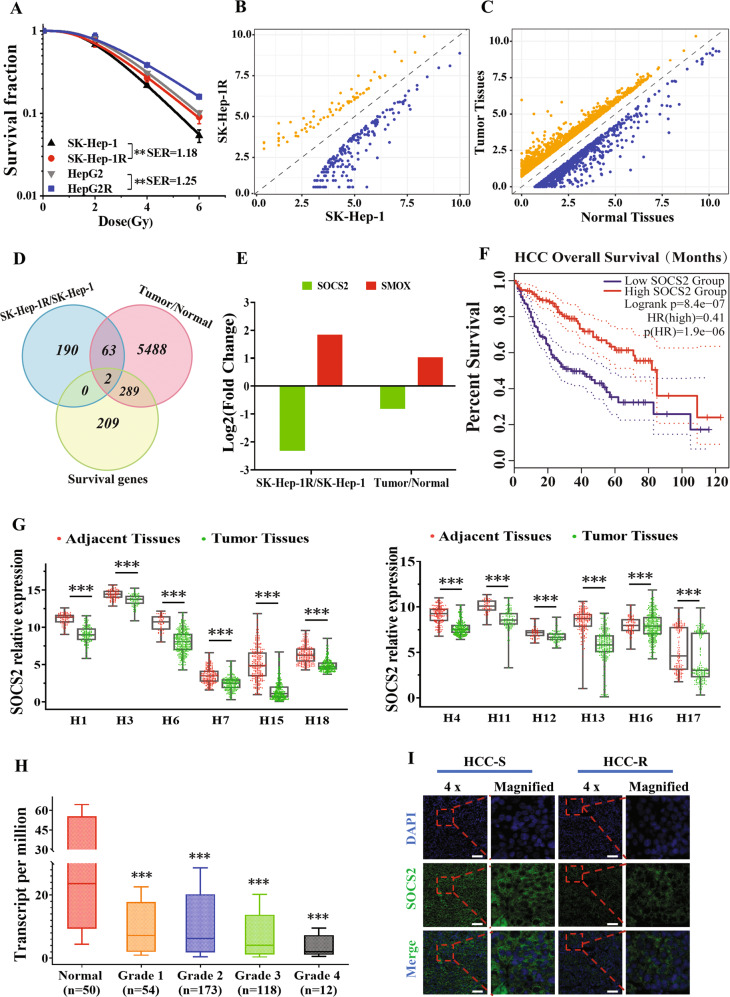
Fig. 1. Overexpression of SOCS2 was correlated with radiosensitization of hepatocellular carcinoma.
A Dose responses of survival fractions of SK-Hep-1, SK-Hep-1R, HepG2 and HepG2R after IR. B Symmetric scatter diagram of differentially expressed genes (DEGs) between SK-Hep-1R and SK-Hep-1 cells. C Symmetric scatter diagram of DEGs between the HCC tumor and paracancerous tissues from TCGA and GEPIA dataset (download data: 2021-09-01). D Venn diagram of the co-expressed DEGs among above two groups (SK-Hep-1R/SK-Hep-1, tumor/normal tissues) and the survival genes for prognosis prediction of HCC from TCGA and GEPIA dataset. E Fold changes of SOCS2 and SMOX gene expressions in SK-Hep-1R cells and tumor tissues in comparison with SK-Hep-1 cells and normal tissues, respectively. F Kaplan-Meier curves of HCC survivals based on the expression status of SOCS2 gene according to TCGA and GEPIA dataset. G Box scatter diagrams of the relative expression level of SOCS2 in tumor and adjacent normal tissues according to 12 cohorts in HCCDB. The central mark is the median; the edges of the box are the 25th and 75th percentiles. H refers to HCCDB. H Boxplot of the relative expression level of SOCS2 in normal and tumor tissues of HCC patients with four pathological grade 1, 2, 3 or 4 from UALCAN database. The central mark is the median; the edges of the box are the 25th and 75th percentiles. I Representative immunofluorescence images of SOCS2 protein in tumor tissues of radioresistant HCC patients (HCC-R) (n = 12) and radiosensitive HCC patients (HCC-S) (n = 12). Nuclei were stained with DAPI (x4). Scale bars, 100 μm. *P < 0.05, **P < 0.01 and ***P < 0.001 between indicated groups.

