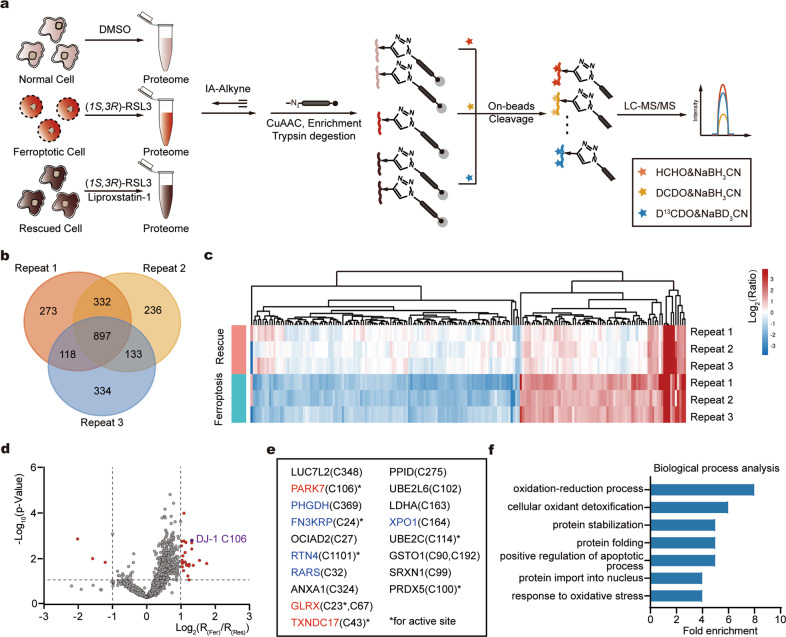
Fig. 1. Quantitative profiling of the perturbed cysteinome in ferroptosis.
a The scheme of quantitative profiling of reactive cysteines in ferroptotic proteomes by rdTOP-ABPP. Equal number of HT1080 cells were treated with DMSO, RSL3 and with or without Liproxstatin-1, respectively, for 6 h. The whole proteomes were labeled with cysteine-reactive IAyne probes, and then subjected to the rdTOP-ABPP procedures. b A venn diagram showing the number of reactive cysteines quantified from three biological replicates. c Hierarchical clustering analysis of perturbed cysteines based on their quantified rdTOP-ABPP ratios. Each row in the heat map represents the data from each individual profiling experiment. d Volcano plot of the rdTOP-ABPP ratios for each cysteine site quantified in the ferroptotic cells as compared to that in the rescued cells. In the upper left and right quadrants are reactive cysteines with significantly changed reactivity during ferroptosis (n = 3 per group, p-value < 0.05, 0.5 <R(Fer)/R(Fer) <2). Highlighted in red are cysteines with significantly suppressed reactivity during ferroptosis. e List of cysteines with suppressed reactivity during ferroptosis. Proteins in red are redox regulated proteins and proteins in blue are carbonylated proteins. * indicates the active-site cysteine in the host proteins. f Gene ontology analysis of the cysteines with suppressed reactivity during ferroptosis in terms of biological processes.

