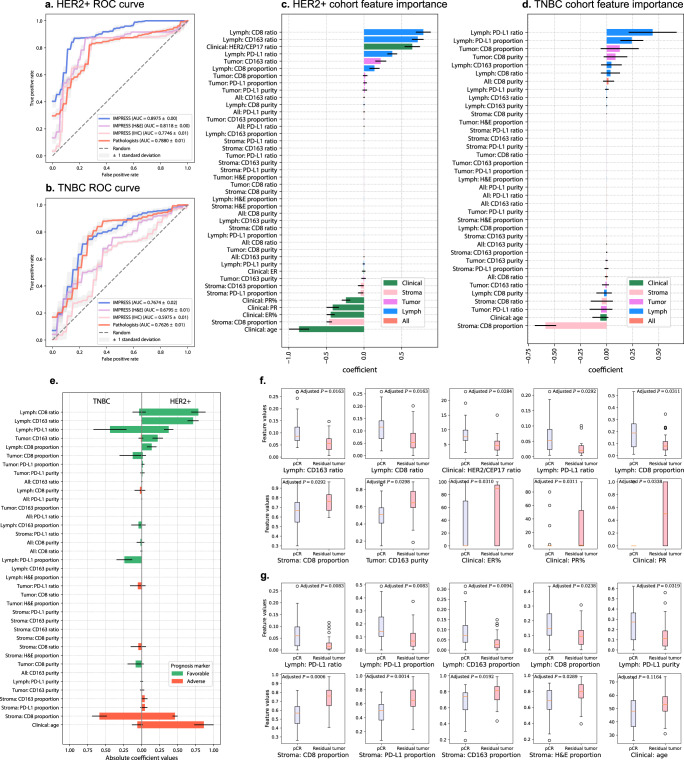
Fig. 3. LASSO-regularized logistic regression machine learning model predicts NAC outcomes.
a, b Receiver operating characteristic (ROC) curve for HER2+ (a) and TNBC (b) cohorts in the logistic regression results. Blue line: IMPRESS plus clinical features; Purple line: IMPRESS (H&E features only) plus clinical features; Pink line: IMPRESS (IHC features only) plus clinical features; Red line: pathologists assessed plus clinical features. c, d Feature importance generated by logistic regression. Positive coefficients are associated with better prognosis (pCR) and vice versa. Horizontal line in each bar stands for standard deviation. c HER2+ cohort; d TNBC cohort. e Comparison of IMPRESS and clinical coefficient importance in machine learning results between HER2+ and TNBC cohorts, organized by HER2+ coefficients in descending order. Coefficients in the horizontal bar plot were reported in absolute values, the positive values were defined as “favorable” prognostic markers and vise versa for negative values. Figure best viewed in colors. Horizontal line in each bar stands for standard deviation. f, g Univariate feature analysis in HER2+ cohort (f) and TNBC cohort (g) by comparing pCR cases against residual tumor cases. In f and g, top row showed five most favorable features, bottom row showed five most adverse features. Two-sided P-values were calculated based on Student’s t-test, followed with B&H procedure for multiple test adjustment (FDR = 0.05). For boxplot, the interior horizontal red line represents the median value, the upper and lower box edges represent 75th and 25th percentile, and the upper and lower bars represent the 90th and 10th percentiles, respectively.

