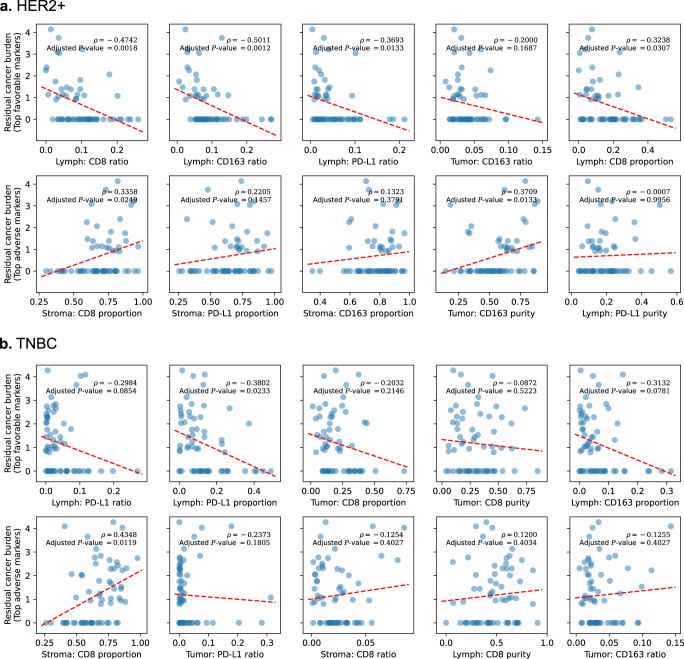
Fig. 4. Scatter plot with Spearman’s rank correlation coefficient ρ and P-value between IMPRESS features and residual cancer burden (RCB).
a HER2+ cohort, first row: top 5 favorable IMPRESS features; second row: top 5 adverse IMPRESS features; b TNBC cohort, first row: top 5 favorable IMPRESS features; second row: top 5 adverse IMPRESS features. Dashed red lines represent the fitted linear regression slopes. All P-values were adjusted with B&H procedure (FDR = 0.05).

