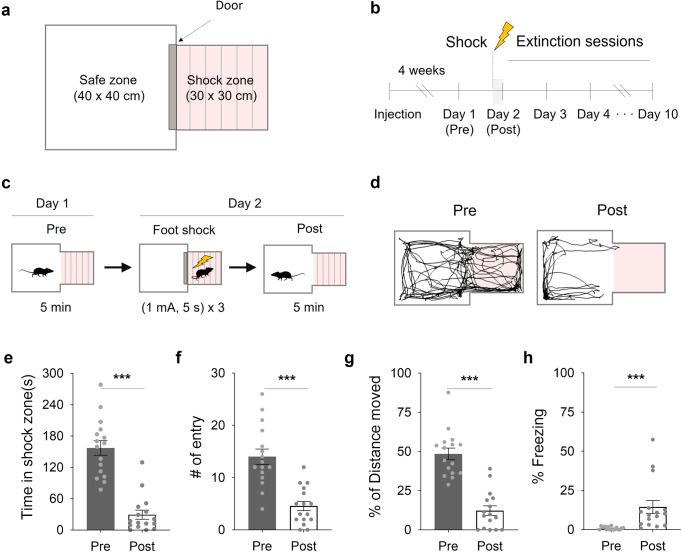
Fig. 1. A focal zone-fear paradigm for fear conditioning.
a A schematic depiction of the focal zone-fear conditioning. b The focal fear-conditioning timeline. c The fear-conditioning and pre/post-test schedules. d A representative tracking of the center point of a mouse both before (Pre) and after (Post) the shock session. e Time in the shock zone before and after the shock session (n = 16; paired two-tailed t-test,). f The number of entries into the shock zone before and after the shock session (n = 16; Wilcoxon Signed Rank Test). g Freezing percentage before and after the shock session (n = 16; Wilcoxon Signed Rank Test). h The percentage of distance moved in the shock zone before and after the shock session (n = 16; paired two-tailed t-test). ***p < 0.001. All error bars represent s.e.m. Further information on statistical analyses is given in the supplementary data 1.

