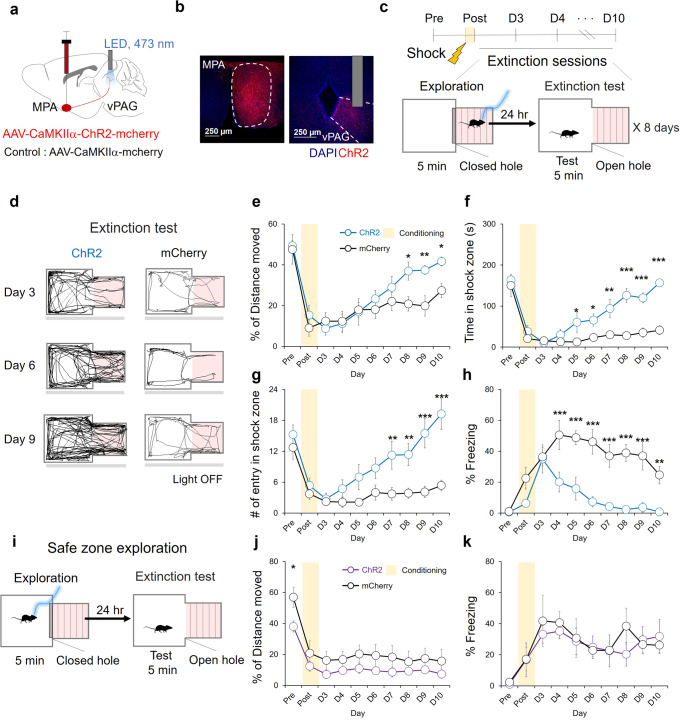
Fig. 2. Exploration of the fear-conditioned zone induces fear extinction.
a A schematic depiction of virus injection and photostimulation (3 mW, 20 Hz, 5 ms). b A representative image of AAV2/9-CaMKIIα-hChR2-mCherry expression (red) in the MPA and the vPAG. Scale bar: 250 μm. c Fear extinction protocol with MPA-vPAG circuit stimulation. d A representative tracking of the center points of mouse during the extinction test. e The percentage of distance moved in the shock zone during the extinction test. The ChR2 group (blue, n = 8) and the mCherry group (black, n = 8; two-way RM ANOVA test, Holm-Sidak post-hoc analysis). f Time in shock zone during extinction test. The ChR2 group (blue, n = 8) and the mCherry group (black, n = 8; two-way RM ANOVA test, Holm-Sidak post-hoc analysis). g The number of entries into the shock-paired zone during the extinction test. The ChR2 group (blue, n = 8) and the mCherry group (black, n = 8; two-way RM ANOVA test, Holm-Sidak post-hoc analysis). h The percentage of freezing during the extinction test. The ChR2 group (blue, n = 8) and the mCherry group (black, n = 8; two-way RM ANOVA test, Holm-Sidak post-hoc analysis). i Modified focal zone-fear conditioning protocol. Photostimulation in a safe zone during exploration. j The percentage of distance moved in the shock zone during the extinction test. The ChR2 group (purple, n = 6) and the mCherry group (black, n = 4; two-way RM ANOVA test, Holm-Sidak post-hoc analysis). k The percentage of freezing during the extinction test. The ChR2 group (purple, n = 6) and the mCherry group (black, n = 4; two-way RM ANOVA test, Holm-Sidak post-hoc analysis). *p < 0.05, **p < 0.01, ***p < 0.001. All error bars represent s.e.m. Further information on statistical analyses is given in the supplementary data 1.

