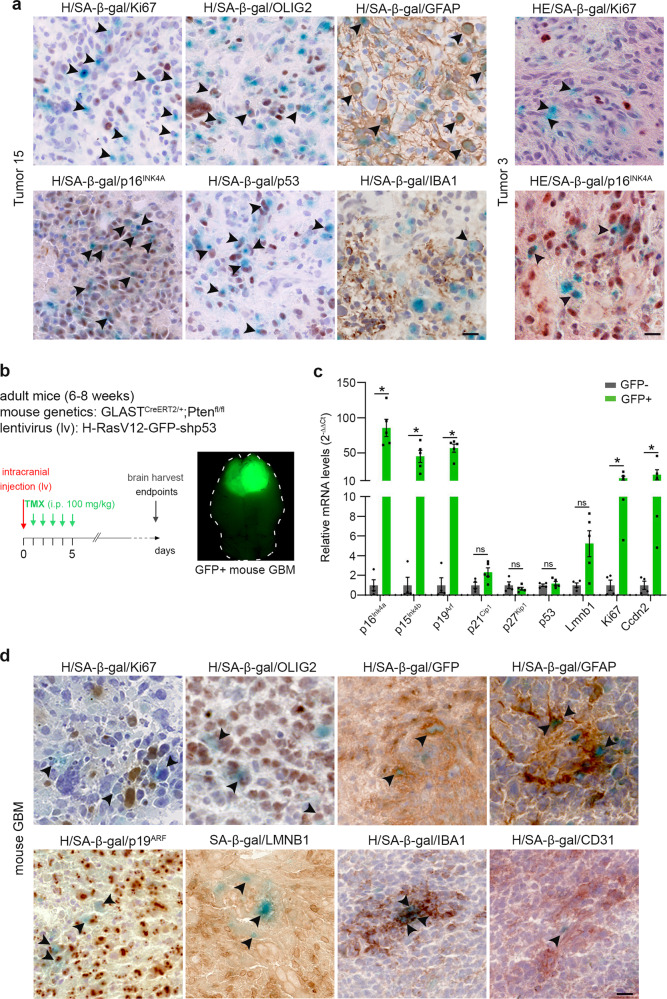
Fig. 1. Identification of senescent cells in patient and mouse gliomas.
a Representative SA-β-gal staining (blue) coupled with immunohistochemistry (IHC, brown) on two non-fixed patients GBM cryosections samples (Ki67 and GFAP: n = 16; p16INK4A: n = 12; IBA1: n = 10; p53: n = 7 and OLIG2: n = 6 patient GBMs). b Left: genetics of the mouse mesenchymal GBM model (mouse and injected lentivirus (lv)). The timeline represents the induction of tumorigenesis with tamoxifen intraperitoneal (i.p.) injections (TMX, 100 mg/kg/day for 5 days). Brains are harvested when mice reach endpoints. Right: the representative stereomicroscopic image of a mouse brain with a GFP+ GBM. c Relative transcript levels shown as ratios of normalized values of mouse GBM (GFP+, n = 5) over surrounding parenchyma (GFP−, n = 4). Data are represented as the mean ± SEM. Statistical significance was determined by the Wilcoxon–Mann–Whitney test (*p < 0.05; ns, not significant). d Representative SA-β-gal staining (blue) coupled with IHC (brown) on mouse GBM cryosections. (Ki67, p19, IBA1 and GFP: n = 8; GFAP: n = 6; OLIG2 and CD31: n = 5; LMNB1: n = 4 independent mouse GBMs). Arrowheads in a, d point to SA-β-gal+ cells co-labeled for the markers OLIG2, GFP, GFAP, p19ARF, or IBA1. For Ki67, LMNB1, and CD31 IHC, the arrowheads point to mono-labeled SA-β-gal+ cells. Scale bars, a and d: 20 µm. H hematoxylin, HE hematoxylin, and eosin, i.p. intraperitoneal, TMX tamoxifen. Raw data are provided as a Source Data file.

