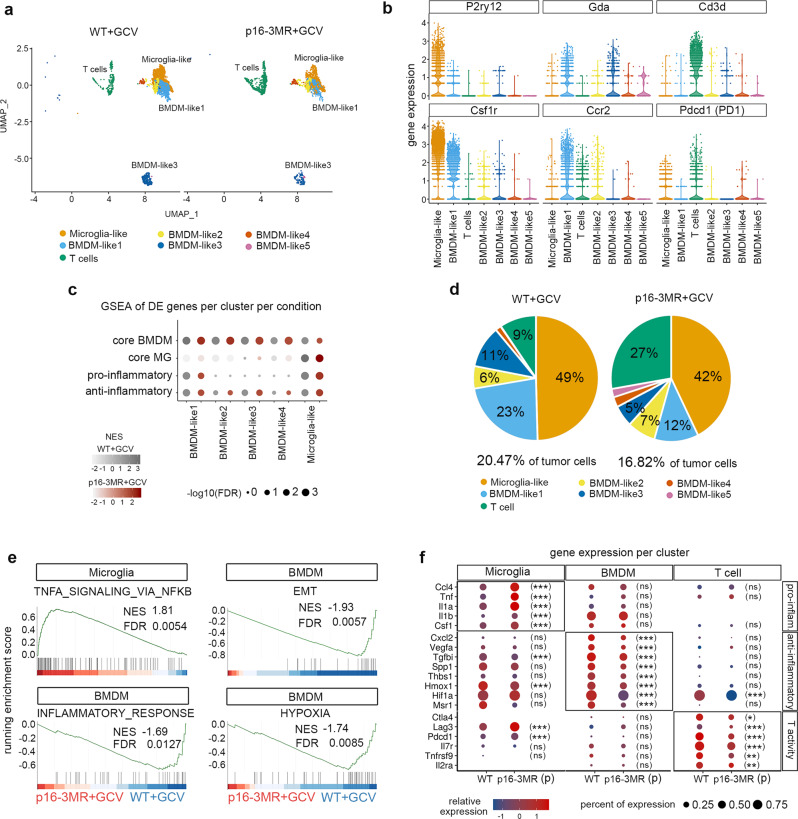
Fig. 4. Modulation of the immune compartment following p16Ink4a Hi cells partial removal.
a UMAP plots of CD45+ cells in WT+GCV and p16-3MR+GCV GBMs at a 0.5 resolution and annotated cell type. b Violin plots representing the expression of selected DE genes (FDR < 0.05; avlogFC > 0.25) per cluster in WT+GCV GBMs. c GSEA dot plot of DE genes (FDR < 0.05; avlogFC>0.25) in WT+GCV (gray dots) and p16-3MR+GCV (red dots) CD45+ clusters of core-BMDM, core-MG, pro-inflammatory and anti-inflammatory pathways as defined in Bowman et al.45 and Darmanis et al.32 (Supplementary Data 1). d Chart pies representing the percentage of CD45+ cells per cluster in WT+GCV and p16-3MR+GCV GBMs. e GSEA graphs representing the enrichment score of Hallmark gene lists in p16-3MR+GCV compared with WT+GCV microglia clusters and pooled BMDM clusters. The barcode plot indicates the position of the genes in each gene set; red represents positive Pearson’s correlation with p16-3MR+GCV expression and blue with WT+GCV expression. f Dot plots of the relative expression of selected genes in WT+GCV and p16-3MR+GCV microglia, pooled BMDM and T cells clusters. Statistical significance of the expression of genes in p16-3MR+GCV compared with WT+GCV clusters was determined by the Wilcoxon–Mann–Whitney test (ns, not significant, *p < 0.05; **p < 0.01; ***p < 0.001). UMAP uniform manifold approximation and projection, BMDM bone marrow-derived macrophages, MG microglia, DE differentially expressed, EMT epithelial to mesenchymal transition, GSEA gene set enrichment analysis, FDR false discovery rate, NES normalized enrichment score. Raw data are provided as a Source Data file.

