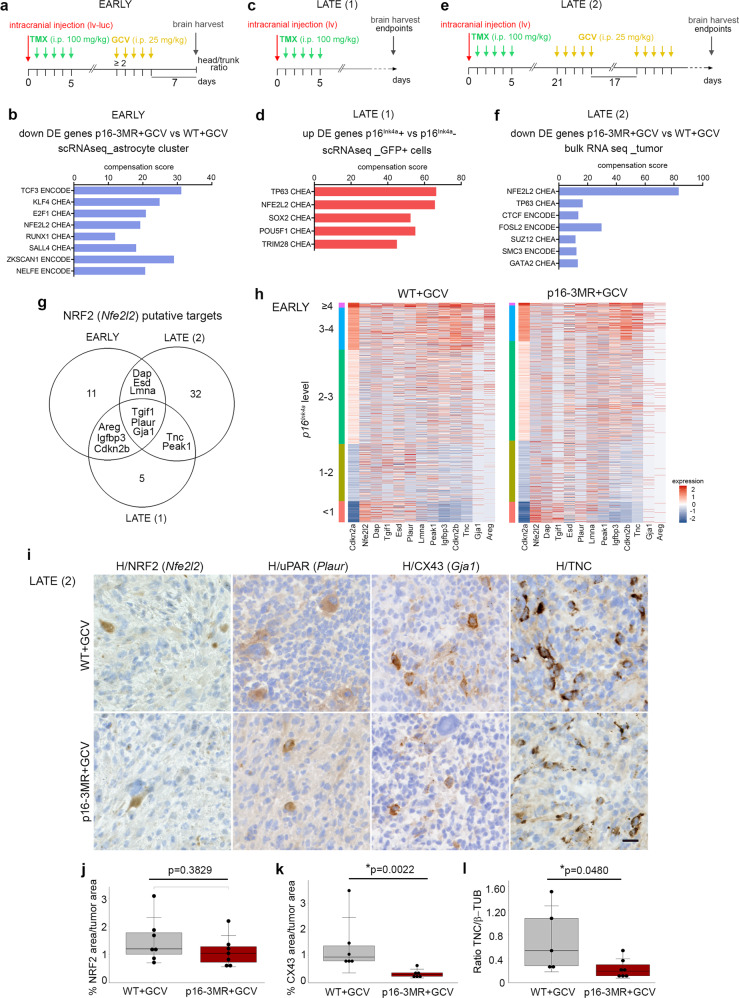
Fig. 5. Identification of NRF2 activity and its putative targets in p16Ink4a Hi malignant cells.
a Timeline of the mouse GBM generation for scRNAseq at the early timepoint (EARLY). b Barplot corresponding to significantly enriched pathways (ENCODE and ChEA consensus TFs from ChIP-X, Enrichr) in differentially downregulated genes (FDR < 0.05; avlogFC>0.25) in the p16-3MR+GCV compared with the WT+GCV astrocyte clusters from the scRNAseq data (as shown in a). c Timeline of the mouse GBM generation for scRNAseq at the late timepoint (LATE (1)). d Barplot corresponding to significantly enriched pathways in differentially up-regulated genes (FDR < 0.05; logFC > 0.5) in p16Ink4a positive vs. p16Ink4a negative malignant cells from the scRNAseq data (as shown in c). e Timeline of the mouse GBM generation for bulk RNAseq at the late timepoint (LATE (2)). f Barplot corresponding to significantly enriched pathways in differentially down-regulated genes (FDR < 0.05; logFC > 0.5) in p16-3MR+GCV compared with WT+GCV GBMs from the bulk RNAseq data (as shown in e). g Venn diagram of NRF2 putative targets between the 3 gene sets as shown in (a, c, and e). h Heatmaps of Nrf2 and its 11 identified putative targets in WT+GCV and p16-3MR GBMs. Cells are classified into five categories according to p16Ink4a expression levels. i Representative immunohistochemistry (IHC, brown) counterstained with hematoxylin (H, purple) on mouse GBM cryosections at the late timepoint. H hematoxylin. (NRF2: WT+GCV, n = 7; p16-3MR+GCV n = 7; uPAR: WT+GCV, n = 3; p16-3MR+GCV, n = 3; CX43: WT+GCV, n = 5; p16-3MR+GCV, n = 6; TNC: WT+GCV, n = 5; p16-3MR+GCV, n = 7 independent mouse GBMs). Scale bar: 20 µm. j Quantification of the NRF2 area (IHC) over the tumor area (WT+GCV, n = 7; p16-3MR+GCV, n = 7 independent mouse GBMs). k Quantification of the CX43 area (IHC) over the tumor area (WT+GCV, n = 6; p16-3MR+GCV, n = 6 independent mouse GBMs). l Quantification of the ratio of TNC over β-TUBULIN expression (western blot) (WT+GCV, n = 5; p16-3MR+GCV, n = 7 independent mouse GBMs). Raw data are shown in Supplementary Fig. 5g. j–l data are presented as the mean ± SD. Statistical significance was determined by the Wilcoxon–Mann–Whitney test (*p < 0.05). i.p. intraperitoneal, lv lentivirus, lv-luc lentivirus-luciferase, TMX tamoxifen, DE differentially expressed GCV ganciclovir, H hematoxylin. Raw data are provided as a Source Data file.

