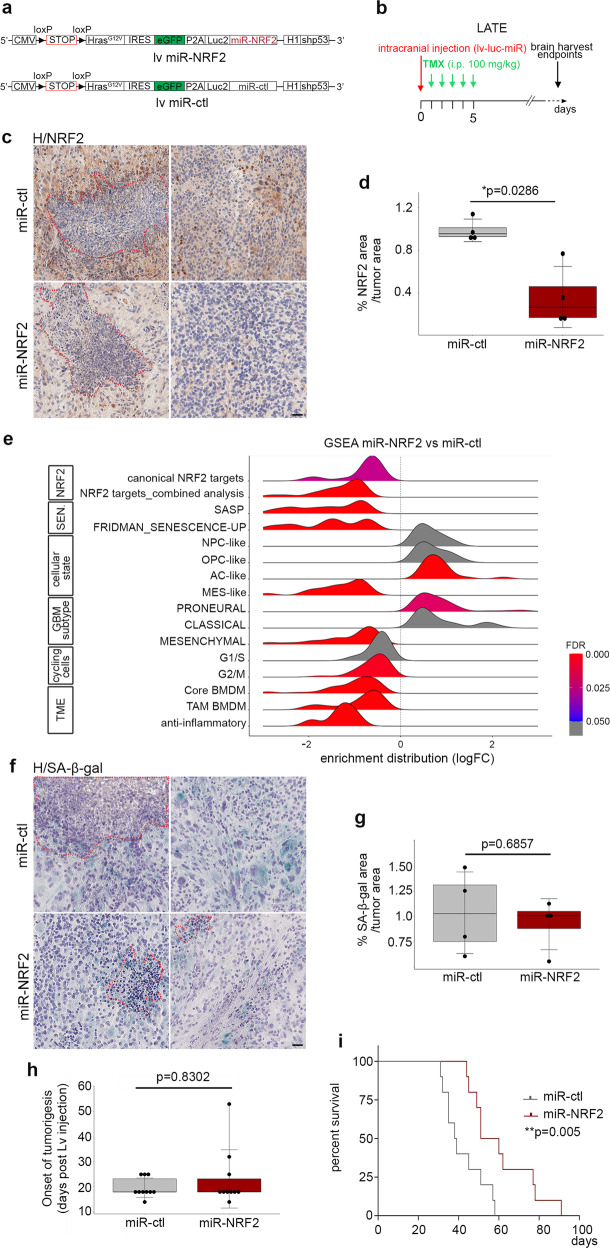
Fig. 6. Knockdown of NRF2 in malignant cells recapitulates most features of the senolytic treatment.
a Scheme of the lentiviral vector containing either a miR-NRF2 or a miR-ctl. b Timeline of the mouse GBM generation at the late timepoint. c Representative NRF2 IHC staining (brown) on miR-ctl (n = 4) and miR-NRF2 (n = 4) GBM cryosections. Necrotic areas are outlined in red dashed lines. d Quantification of the NRF2 area (IHC) over the tumor area (miR-ctl n = 4; miR-NRF2 n = 4). e GSEA ridge plot on bulk RNAseq of miR-NRF2-GBMs compared with miR-ctl-GBMs (see Supplementary Data 1 for gene lists). f Representative SA-β-gal (blue) staining on miR-ctl (n = 4) and miR-NRF2 (n = 4) GBM cryosections. Necrotic areas are outlined in red dashed lines. g Quantification of the SA-β-gal area over the tumor area (miR-ctl n = 4; miR-NRF2 n = 4). h Boxplot representing the onset of tumorigenesis in miR-ctl (n = 10) and miR-NRF2 (n = 10) mice following post-lentiviral injection. The onset of tumorigenesis is defined when the bioluminescence reached 3e106. i Kaplan–Meier survival curves of miR-ctl (n = 10, median survival 38.5 days) and miR-NRF2 mice (n = 10, median survival 55.5 days). Statistical significance was determined by the Mantel–Cox log-rank test (**p < 0.01). Scale bar, c and f 50 µm. d, g, h Statistical significance was determined by Wilcoxon–Mann–Whitney test (*p < 0.05). lv lentivirus, miR-ctl miR-control, H hematoxylin, GSEA gene set enrichment analysis, sen. senescence, TAM-associated macrophages, BMDM bone marrow-derived macrophages. Raw data are provided as a Source Data file.

