
Figure 6.
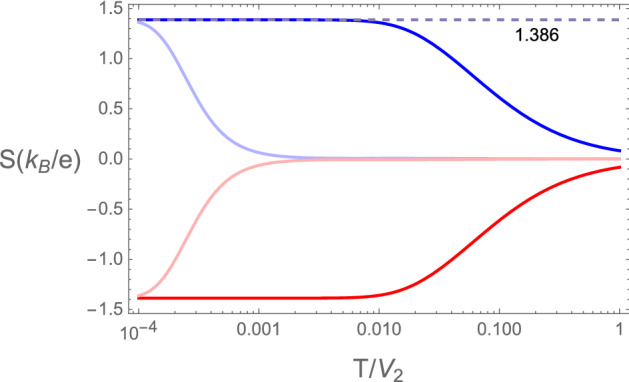
Thermopower of the device as a function of temperature in units of at the topological transition of the RM chains. correspond to , and (light curve). Negative thermopower () corresponds to and (light curve). The light color curves show the trend to the results the SSH chain with . The energy scale for the low temperature saturation of the thermopower is given by the difference in site energies, . The numerical results for the saturation values, are in close agreement with , as discussed in the text.