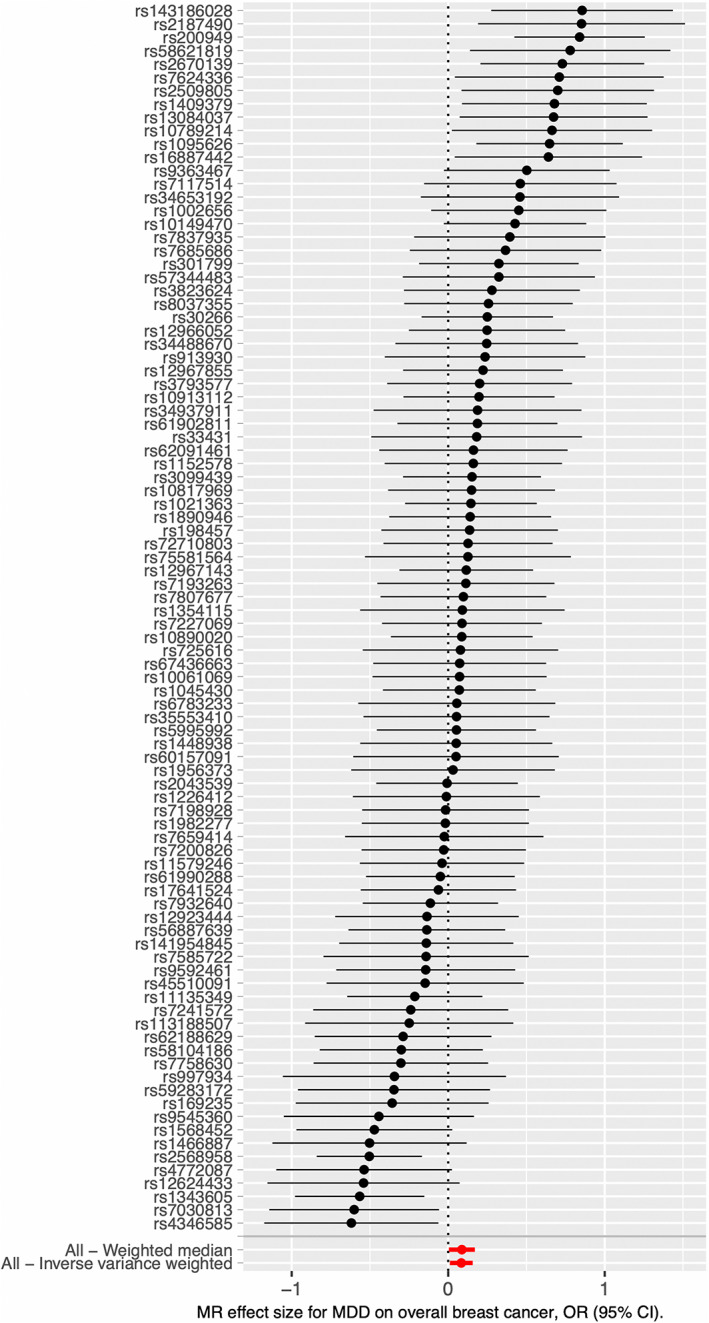
FIGURE 2.

Forest plot of the two‐sample MR analysis results between MDD and the risk of breast cancer using conventional inverse variance weighted (IVW) and weighted median methods. Each black dot and horizontal line represented the causal effect obtained by Wald ratio method and 95% CI for individual IV, respectively. The red dots and horizontal lines at the bottom represent the overall causal effects obtained by different methods and 95% CI, respectively. X‐axis is shown in natural logarithmic scale.
