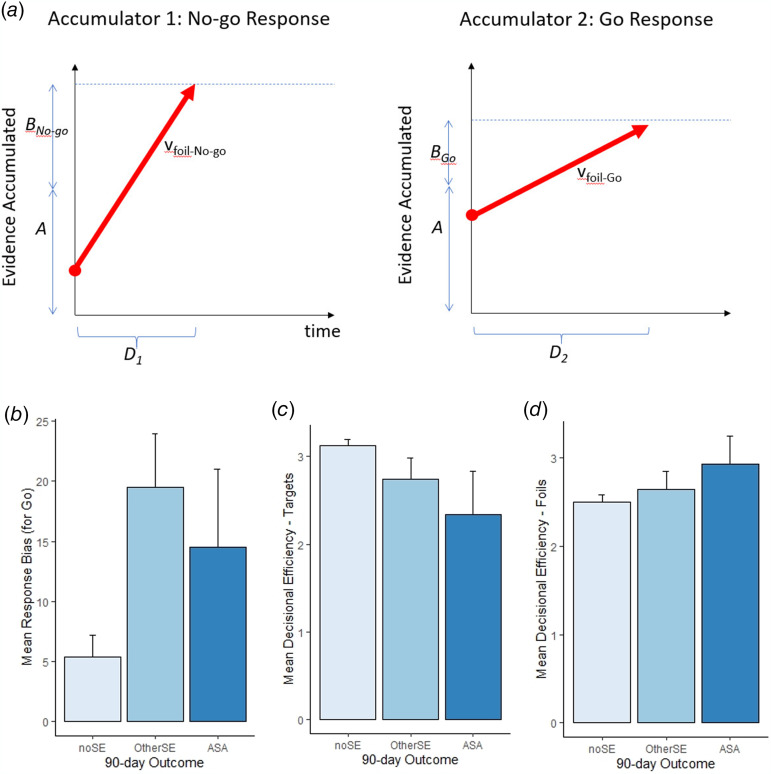
Fig. 2.
The linear ballistic accumulator model (LBA) adapted to apply to Go/No-go task. (a) Schematic of the LBA model, showing one evidence accumulator for each response (here, No-go and Go); at the start of each trial, a starting point for each accumulator is drawn from the uniform distribution U [0…A]; evidence accumulation in each accumulator then follows a trajectory (red lines) with slope drawn from a normal distribution with mean v (where v may be different in each accumulator and for each stimulus type). The first accumulator to reach a threshold A + B (dashed line) ‘wins’ and the corresponding response is triggered. In the example shown here, boundary offset BNo−go > BGo, creating a relative bias in favor of Go responses (less distance to travel to reach threshold in the Go accumulator); however, the mean slope v on foil trials is greater in the No-go than Go accumulator, meaning that evidence accumulation proceeds more swiftly in the No-go accumulator, favoring the correct (No-go) response. Mean slope v on target trials (not shown) is typically steeper in the Go than the No-go accumulator, favoring the correct (Go) response. Total reaction time (RT) on this trial is the time for the winning accumulator to reach threshold plus non-decision time (t0) representing time to encode the stimulus and execute the response. Variability in RT and response across trials is provided by trial-to-trial variability in starting point and in slope. Values of eight free parameters (t0, A, BNo-go, BGo, and v for each combination of stimulus and response) are imputed for each datafile such that the resulting LBA model best predicts the observed RT distributions. (b) Response bias for Go responses, defined as 100*(BNo–go – BGo) is greatest in the OtherSE group, consistent with this group's high rate of false alarms. (c, d) Decisional efficiency for targets and foils are defined as the difference in v between correct and incorrect responses to that type of stimulus, where larger (positive) values indicate more efficiency in deciding to execute the correct response; here, the ASA group has lowest decisional efficiency for targets, consistent with this group's relatively high miss rate, and the highest decisional efficiency for foils. Error bars show SEM.

