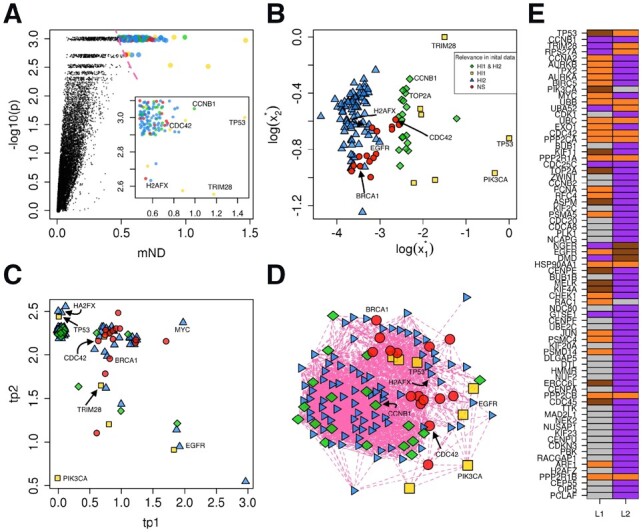
Fig. 4.

Analysis of mutations and expression changes in BC. (A) mND score and empirical P-value; the red dashed line indicates the top 123 genes (subplot); colours and shapes have the same meaning of panel B. (B) Gene diffusion scores of the top 123 genes ranked by mND. (C) tp values (Equation 6) for the two layers. (D) Gene network composed of the top 123 genes ranked by mND; colours and shapes have the same meaning as in panel B. (E) Classification of genes across layers (only the top 75 ranked genes are shown for clarity); brown: isolated; orange: linker; purple: module; grey: not significant. (A–D) Layer 1 (L1): mutations; Layer 2 (L2): expression variations. H1, H2: sets of genes with high initial scores in respectively L1 and L2. NS: not significant, genes not belonging to H1 and H2. Green rhombuses: genes belonging to H1 and H2; blue triangles: genes belonging only to H1; yellow rectangles: genes belonging only to H2; red shapes: genes neither in H1 nor in H2. These results were generated using interactome STRING
