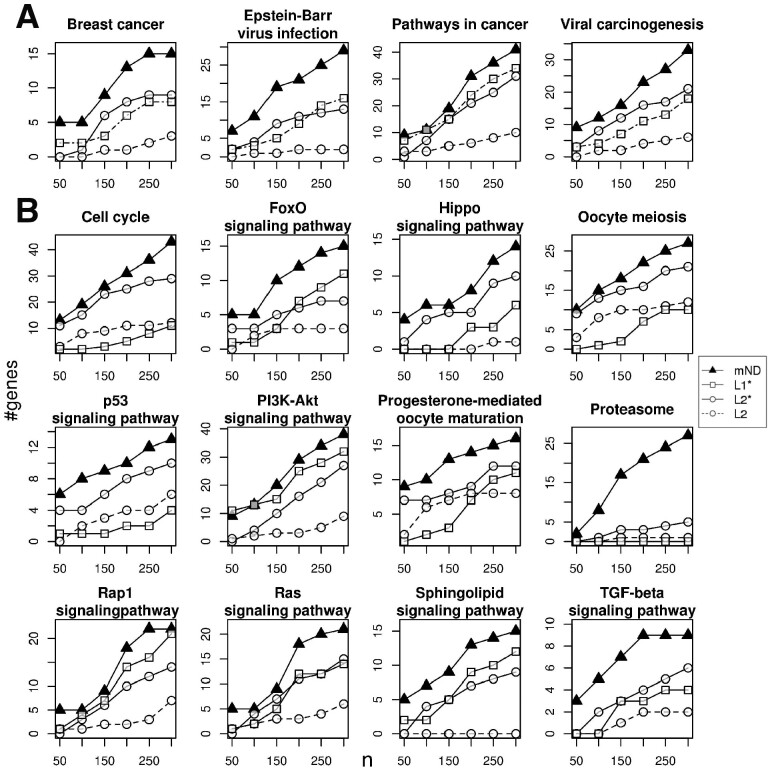
Fig. 5.
Pathways enriched in mutated genes and/or differentially expressed genes in BC. Number of genes found by mND and single omics analyses (L1*, L2* and L2) in each pathway at varying number of top ranking genes considered (horizontal axis, n); L1: mutations; L2: gene expression variations; the asterisk distinguishes between gene ranking by original data and the corresponding network diffusion scores. (A) Disease pathways; (B) other pathways. (A and B) Pathways from KEGG database

