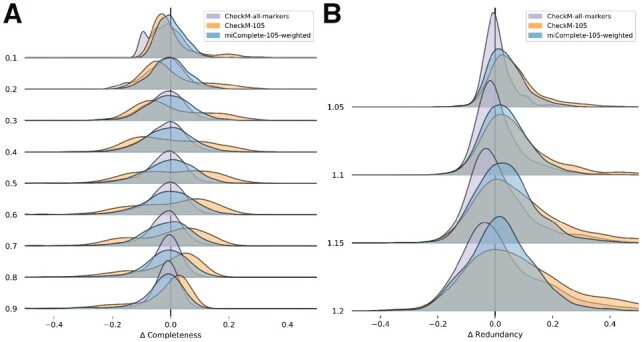
Fig. 1.

Ridgeplots of errors in estimating (A) completeness and (B) redundancy with CheckM, using a fixed marker set (orange) or default settings (purple) and miComplete (blue). Each stapled plot represents the distribution of error (difference between observed and expected value) for increments of simulated completeness (A) or redundancy (B)
