Fig. 1.
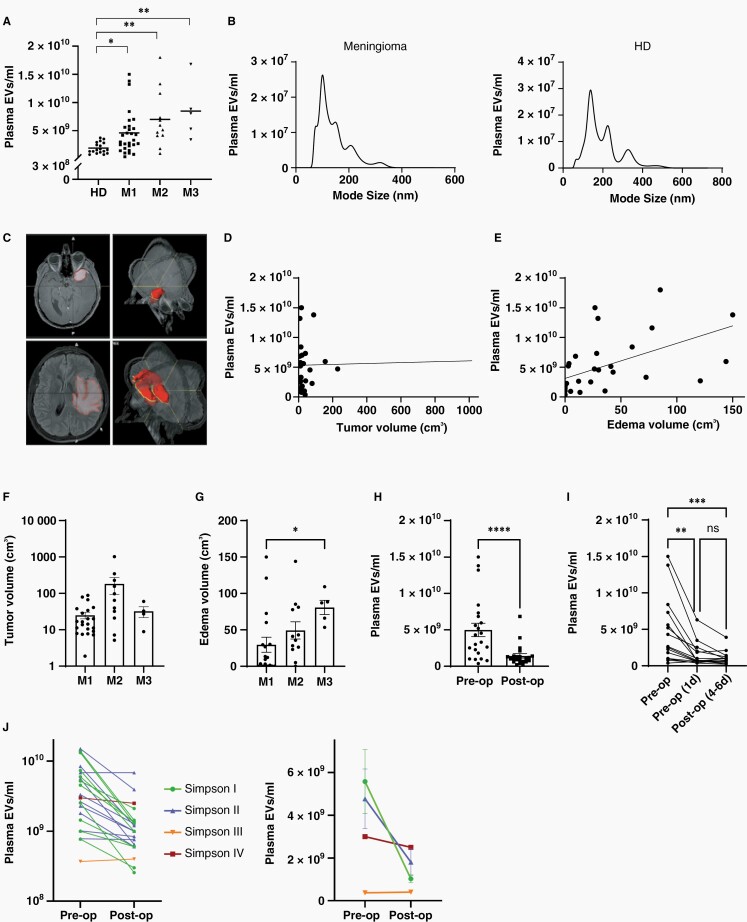
Concentration of plasma EVs in meningioma patients. (A) EV levels in the plasma of meningioma patients (WHO grade 1–3) are increased compared to healthy donors (HD), as determined by nanoparticle tracking analysis, (Kruskal–Wallis, Dunn's; horizontal lines represent means). (B) Size distribution of plasma EVs. (C) Volumetric measurement of tumor size (top) and peritumoral edema (bottom) with 3D reconstruction (right). (D) Relationship between tumor volume and plasma EV concentration (r2 = 0,0009). (E) Association between peritumoral edema volume and plasma EV concentration (r2 = 0.2806). (F) Tumor size of meningiomas of different WHO grades. (G) Association of edema with malignancy grade (Kruskal–Wallis, Dunn's). (H) Reduction of EV concentrations to normal levels 4–6 days postoperatively (n = 22, Wilcoxon signed-rank). (I) EV reduction occurred within the first day after the operation (n = 15, Friedman, Dunn's). (J) Comparison of EV concentration changes (4–6 days postoperatively vs. preoperatively) in individual patients with different extent of tumor resection, as defined by Simpson grading (left panel, n = 22). Mean EV concentration changes in patient groups with different extent of resection (right panel). Postoperative EV reduction was only significant in the Simpson grade I group (P =.0093, 2-way ANOVA, Bonferroni). Values in (F)–(H) are means ± SEM. P values are defined as * <.05, ** <.01, *** <.001, and **** <.0001.

