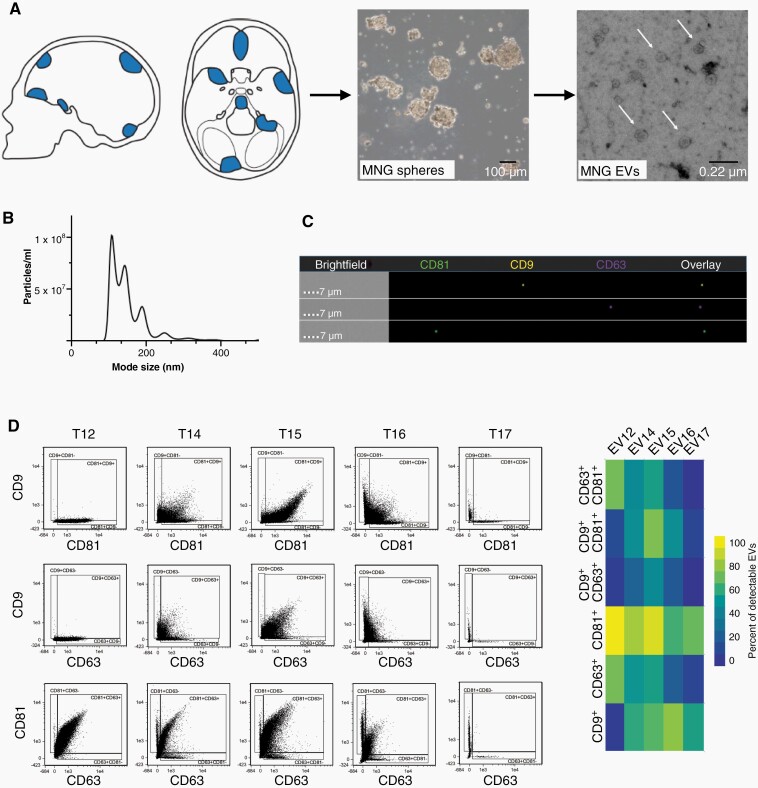
Fig. 2.
Meningioma EV isolation and analysis. (A) Meningioma (MNG) tissue was taken into culture using neurosphere conditions and EVs secreted by the tumor cells were analyzed. Electron microscopy demonstrates the typical cup-shaped morphology of EVs (arrows). (B) Size spectrum of EVs isolated from a meningioma culture. (C) Detection of tetraspanin markers by imaging flow cytometry, representative image. (D) Quantification of the percentage of tetraspanin single-positive and double-positive EVs.

