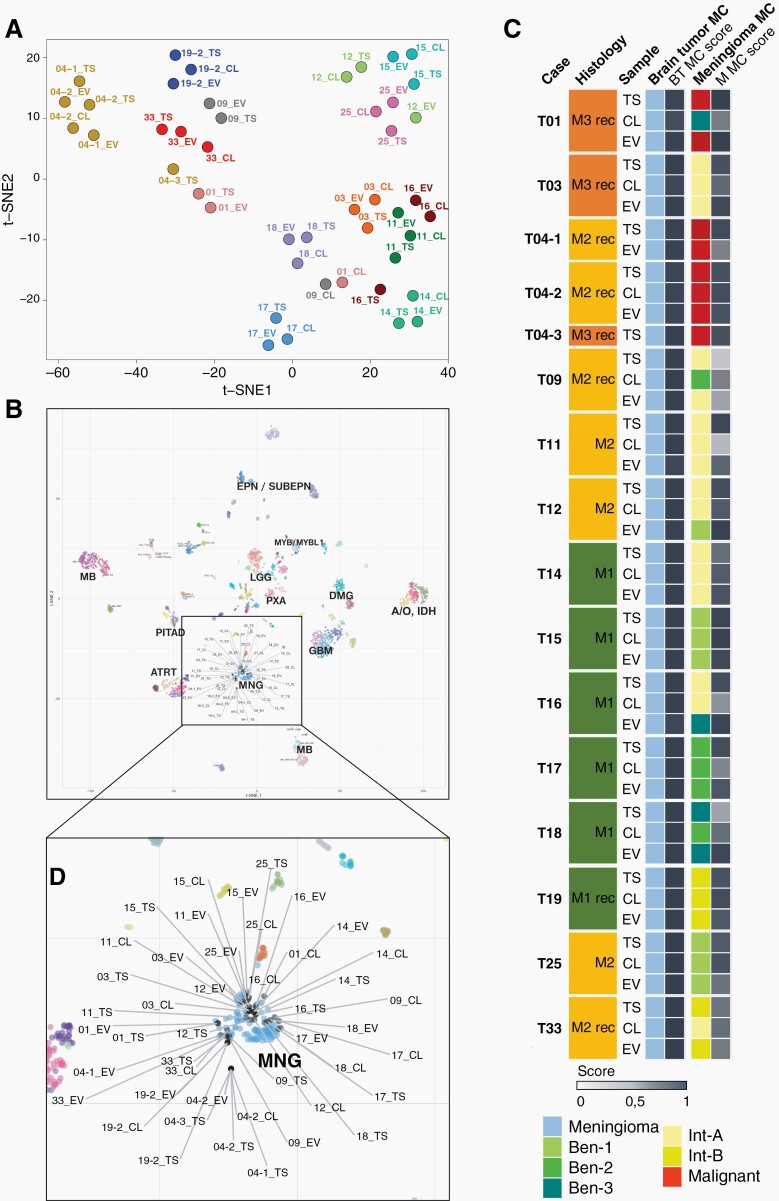
Fig. 3.
DNA methylation profiling. (A) t-SNE analysis of genome-wide methylation profiles of EV-DNA, corresponding cells (CL), and tumor tissue (TS). (B) Comparison of samples with the Heidelberg CNS tumor reference cohort. All EV samples, corresponding cells, and tumor tissue (grey) map to the meningioma (MNG) cluster (light blue). (C) Summarized results of methylation profiling reports. In cases where tumor tissue, cells, or EVs displayed mixed epigenetic signatures, corresponding to more than one methylation class, the colour code represents the class with the higher match score.

