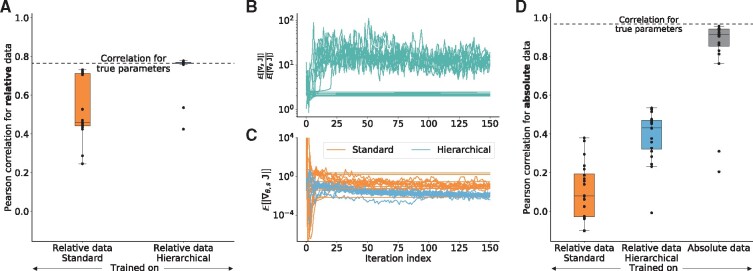
Fig. 2.
Convergence of standard and hierarchical optimization. Parameter estimation results using a simulated version of dataset 1 from Table 1 with the Ipopt optimizer. For all evaluations 20 optimizer runs were performed. (A) Pearson correlation of relative training data and corresponding model simulation after training on relative data using standard and hierarchical optimization. Dashed line shows the correlation that is achieved using the true parameters used to generate the training data. (B) Ratio of the average gradient contribution for scaling parameters against dynamic parameters using the standard optimization for all optimizer runs along their trajectory. (C) Expected gradient for standard and hierarchical optimization. Only the parameters, that were optimized numerically, were taken into account. (D) Pearson correlation of absolute data and corresponding model simulation after training on (left and middle) relative data and (right) on absolute data

