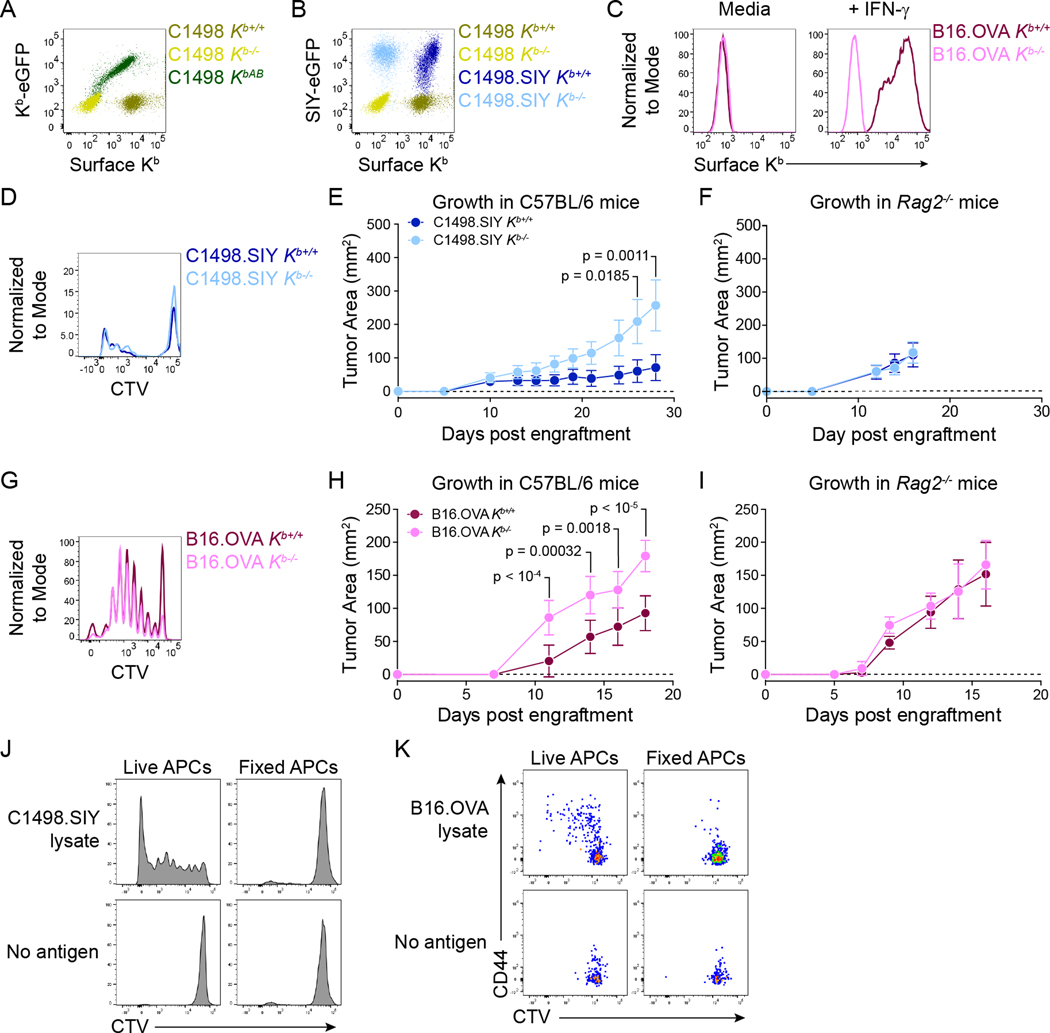
Figure 1: Validation of Kb−/− cancer cell lines. A).
Surface anti-Kb antibody staining and Kb-eGFP expression in C1498 Kb+/+, Kb−/−, and KbAB cells. B) Surface anti-Kb antibody staining and SIY-eGFP expression in C1498 and C1498.SIY Kb+/+ and Kb−/− cells. C) Surface anti-Kb antibody staining on B16.OVA Kb+/+ and Kb−/− cells with and without IFN-γ treatment. D) Histogram showing CTV dilution by 2C T cells after a 72-hour co-culture with BMDCs and C1498.SIY Kb+/+ or Kb−/− cell lysates. E and F) Growth of C1498.SIY Kb+/+ and Kb−/− tumors in C57BL/6 (E) and Rag2−/− mice (F). G) Histogram showing CTV dilution by OT-I T cells following 72-hour co-culture with BMDCs and B16.OVA Kb+/+ or Kb−/− cell lysates. H and I) Growth of B16.OVA Kb+/+ and Kb−/− tumors in C57BL/6 (H) and Rag2−/− (I) mice. J) Histograms showing CTV dilution by 2C T cells following 72-hour co-culture with live or fixed CD11c+ splenocytes and C1498.SIY cell lysates. K) Flow cytometry plots showing CTV dilution and CD44 expression by OT-I T cells following 72-hour co-culture with live or fixed BMDCs and B16.OVA cell lysates. Statistical significance for tumor growth experiments was determined by two-way ANOVA with Sidak’s post-hoc test for multiple comparisons. Tumor growth data are depicted as mean ± s.d. and are pooled from two independent experiments (n = 10 mice per group in E and H; n = 5 mice per group in F) or from one experiment (I, n = 5 mice per group). Flow cytometry plots are representative of at least three independent experiments.

