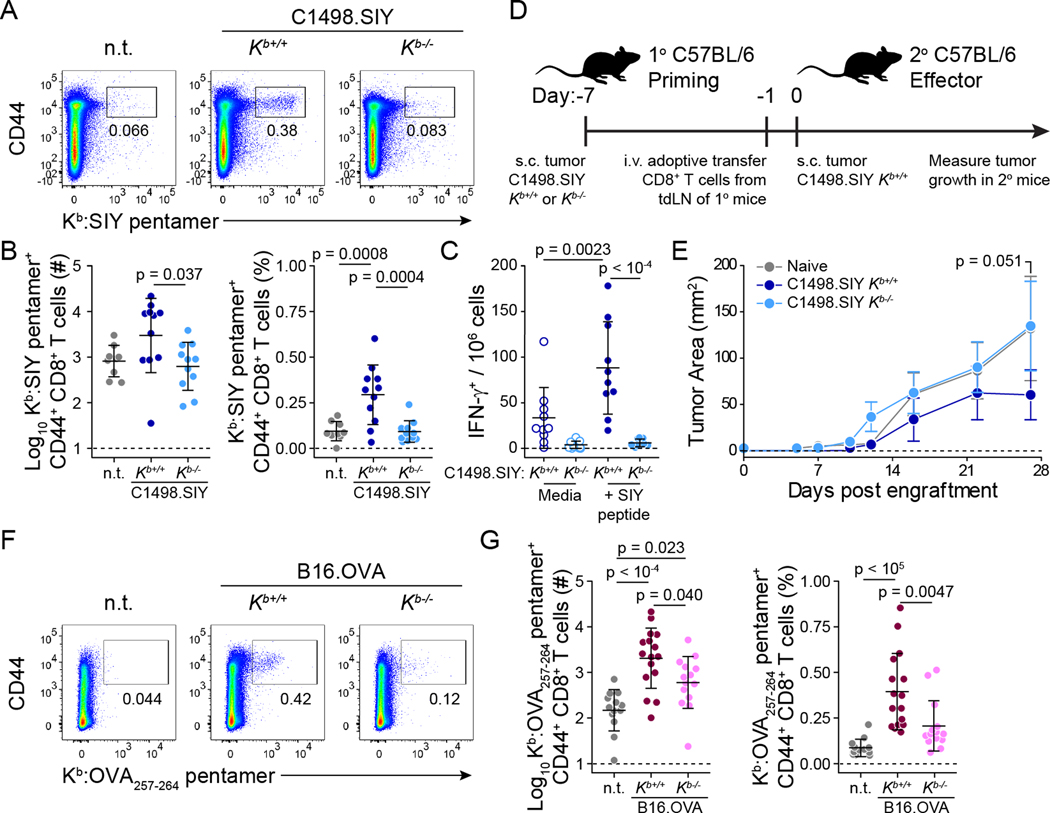
Figure 3: Endogenous antigen-specific CD8+ T cell responses against Kb-restricted tumor antigens are reduced against Kb-deficient tumors. A and B).
Kb:SIY pentamer stain of endogenous CD8+ T cells from tdLNs of C57BL/6 mice bearing C1498.SIY Kb+/+ (n = 11) or Kb−/− (n = 11) tumors or n.t. (n = 8) at day 6. Representative flow cytometry plots are shown in (A), and data are quantified in (B). C) IFN-γ ELISpot on tdLN cells of C57BL/6 mice bearing C1498.SIY Kb+/+ or Kb−/− tumors (n = 10 each) at day 6. D and E) Primary C57BL/6 mice received s.c. challenge with C1498.SIY Kb+/+ or Kb−/− cells on day –7. On day –1, 5 x 10⁶ CD8+ T cells from tdLNs of primary mice, or analogous cutaneous LNs (cLN) of tumor-free mice (n = 8 per group) were transferred into naïve secondary C57BL/6 mice. At day 0, secondary mice were challenged with 106 C1498.SIY Kb+/+ tumor cells, and tumor growth was measured. Experimental design is shown in (D) and the growth of C1498.SIY Kb+/+ tumors in secondary mice is depicted in (E). F and G) Identification (F) and quantification (G) of endogenous OVA257–264-specific CD8+ T cells in tdLNs of mice bearing B16.OVA Kb+/+ (n = 16) or Kb−/− (n = 14) tumors, or n.t. (n = 13) at day 6 by Kb:OVA257–264 pentamer stain. Statistical significance for tumor growth in (E) was determined by two-way ANOVA with Sidak’s post-hoc test for multiple comparisons. For all other comparisons, statistical significance was determined by one-way ANOVA with post-hoc Tukey’s HSD. Tumor growth in (E) is shown as mean ± s.e.m.; other plots are depicted is mean ± s.d. Data are pooled from two (E), three (B and C) or four (G) independent experiments. n.t. = no tumor.

