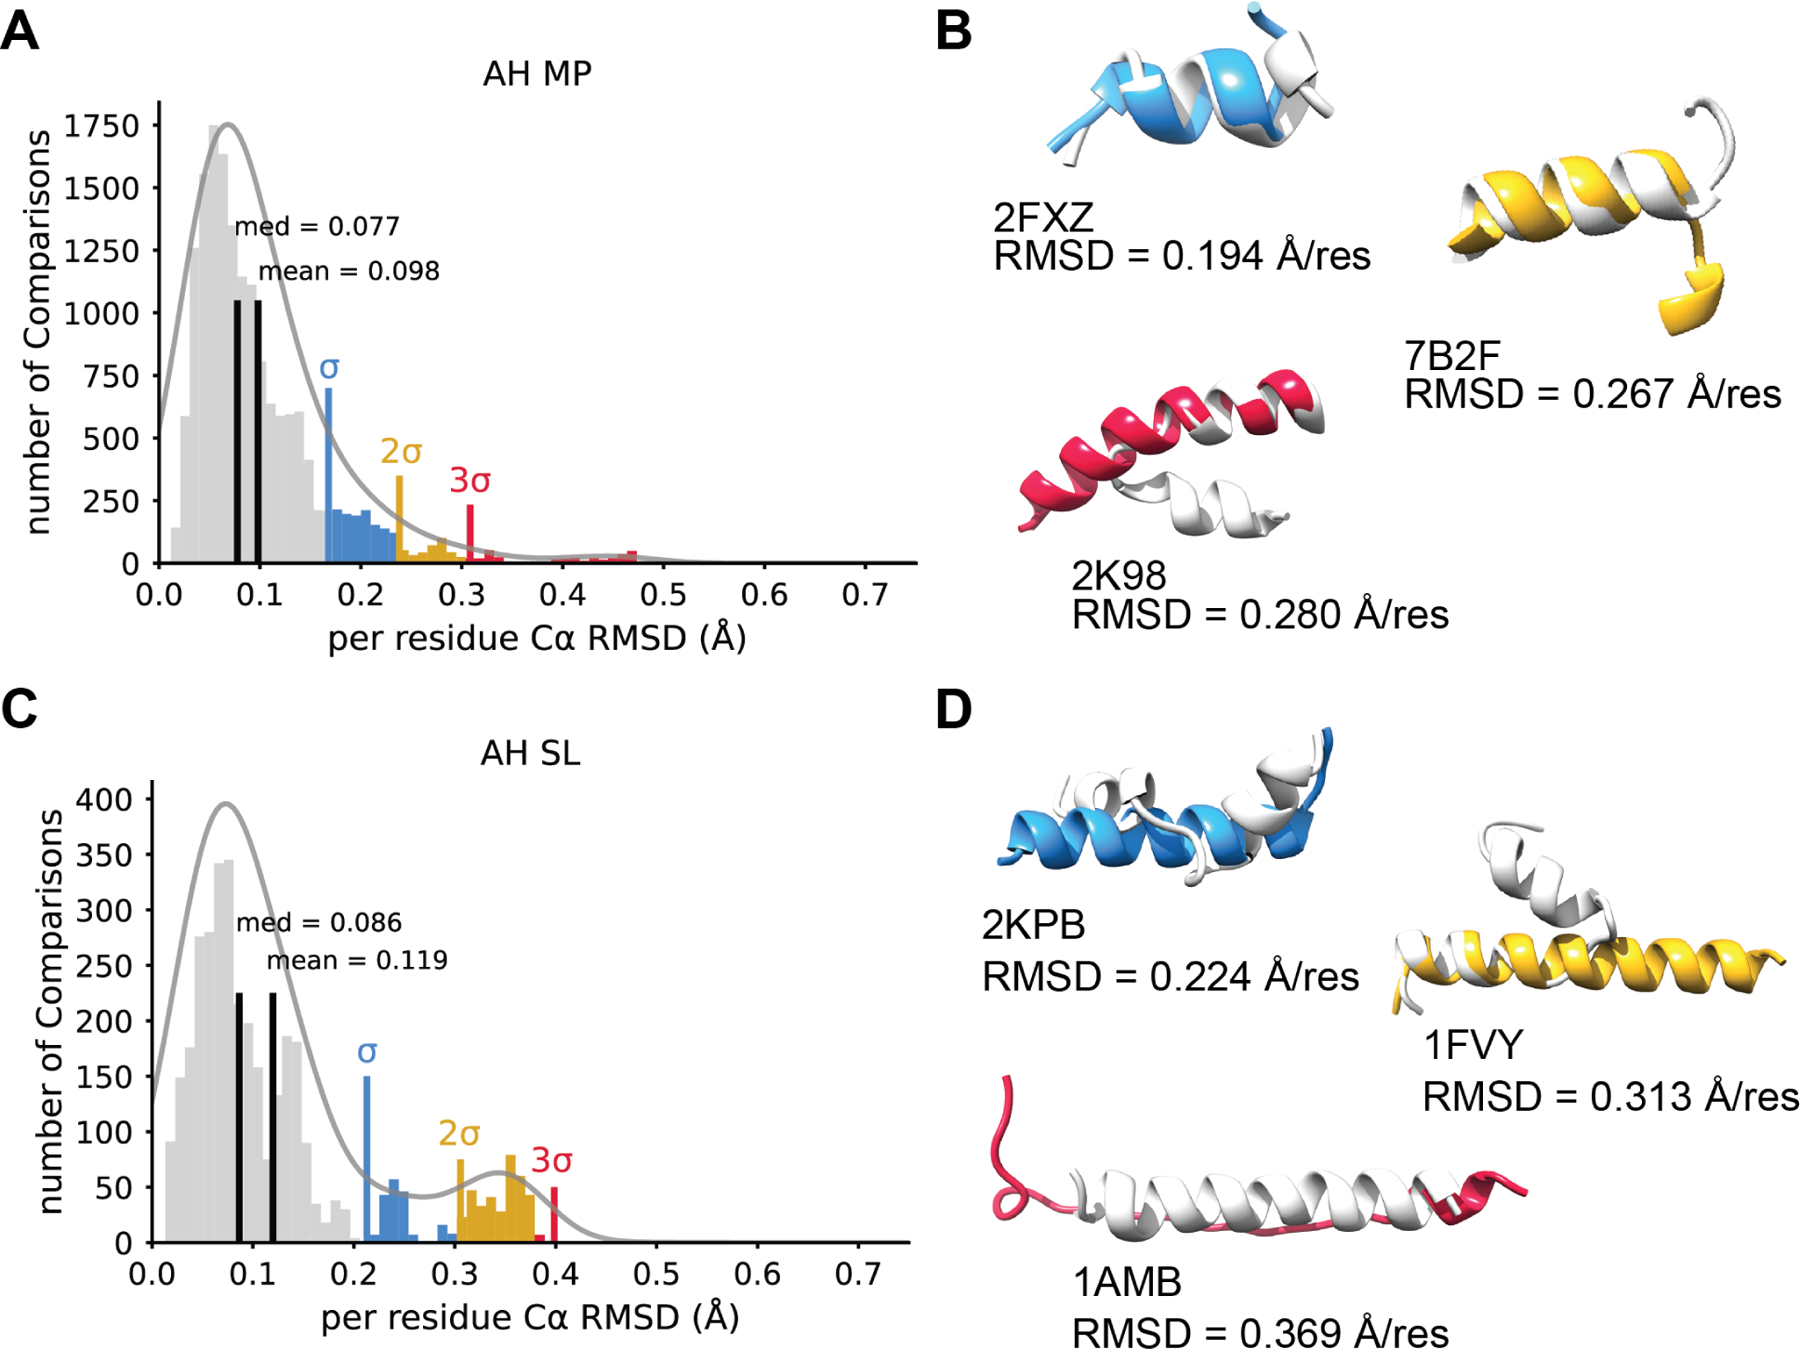
Figure 2. α-helical peptides predictions perform better for membrane associated peptides.

A. A histogram of Cα RMSDs for all comparisons between NMR ensembles and AF2 predictions for α-helical membrane peptides (AH MP) normalized to residue number. The mean and median are shown in black. A multimodal Gaussian was fit to the data using kernel density estimation. One, two and three standard deviations above the mean are shown in blue, yellow, and red respectively. B. Three example models of AF2 predictions that show an RMSD one, two, and three standard deviations above the mean. NMR models are shown in light grey and AF2 models depicted in blue (one standard deviation), yellow (two standard deviations), or red (near three standard deviations). The PDB ID and normalize RMSD value is provided for clarity. C. For comparison, the distribution of α-helical soluble peptides (AH SL) Cα RMSDs between AF2 and NMR plotted as a histogram and normalized to residue number. The mean and median are shown in black. Again, a multimodal Gaussian was fit to the data using kernel density estimation and one, two and three standard deviations above the mean are shown in blue, yellow, and red respectively. D. Example models portraying predictions one, two, and three standard deviation above the mean. The lowest pairwise RMSD is shown for each model. NMR model shown in light grey and the AF2 model is depicted in blue (σ), yellow (2σ), or red (3σ). Note, here 1AMB RMSD falls slightly below the 3σ, but represents the greatest outlier among the AH SL data.
