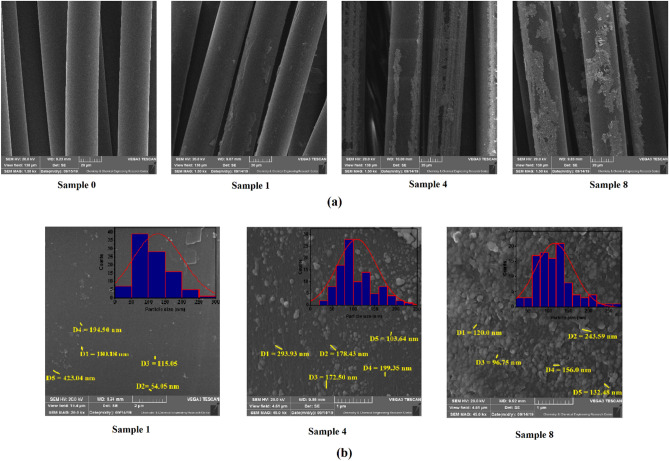
Figure 3.
SEM images of coated and uncoated samples. (a) Deposition of SNPs on fabrics as a function of precursor concentration and sonication time, (b) Particle size and particle size distribution of deposited SNPs. Sample 0 (Uncoated fabric), Samples 1 and 4 (NS-coated fabrics at 2 and 50 mM silver nitrate concentrations, and 25 min sonication time, respectively), Sample 8 (NS-coated fabrics at 50 mM silver nitrate concentration and 50 min sonication time).

