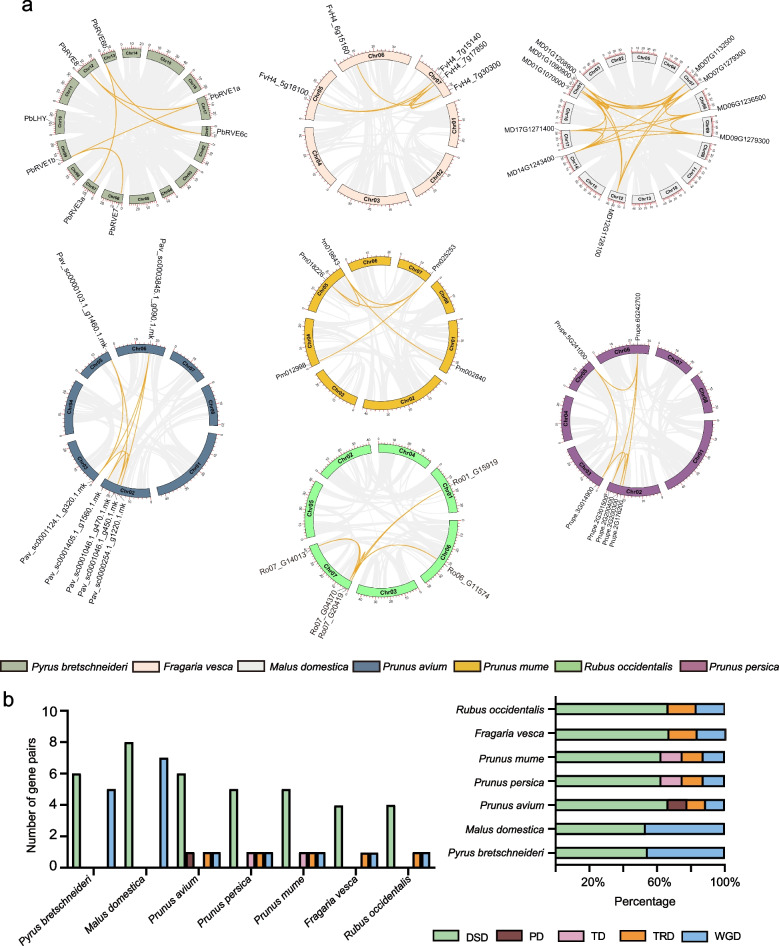
Fig. 3.
Gene intragenomic collinearity and duplication events analysis of the RVE family in Rosaceae species. (a) Localization and intragenomic collinearity of RVE genes. The seven colored circles represent the chromosomes of the seven Rosaceae species. The approximate positions of RVE genes are marked with short black lines on the circles. The yellow lines represent gene pairs with syntenic relationships. Genes located on the scaffolds are not shown. (b) Statistics for different duplication events in seven species, including Pyrus bretschneideri, Malus domestica, Prunus avium, Prunus persica, Prunus mume, Fragaria vesca and Rubus occidentalis. The five colored rectangles represent different events, DSD (green), PD (brown), TD (pink), TRD (orange), and WGD (blue). The Y-axis of the left column chart represents the number of duplicated gene pairs in each event. The X-axis of the right column chart represents the percentage of the duplicated gene pairs in each event

