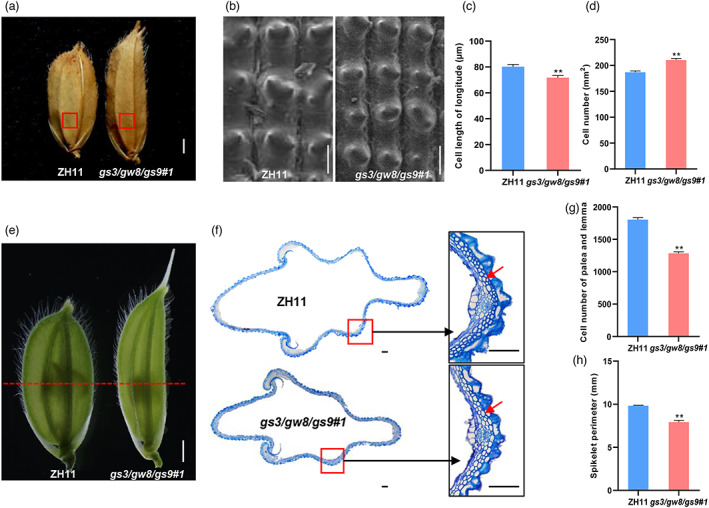
Figure 3.

Histological comparison of the spikelet glumes between ZH11 and the gs3/gw8/gs9#1 triple mutant. (a, b) Scanning electron microscopy analyses of the glume of ZH11 and gs3/gw8/gs9#1. (b) is magnified views (enlarged by 200‐fold) of the red boxes areas in (a). (c) The cell length in longitude indicated with red boxes in (a). Bars indicate SEM (n = 5). (d) The cell number in the areas indicated with red boxes in (a). Bars indicate SEM (n = 5). (e) Spikelet morphology of ZH11 and gs3/gw8/gs9#1 before anthesis. The yellow dashed line indicates the position of the cross‐sections shown in (f). Bar = 1 cm. (f) Transverse sections of spikelet. The right‐hand images show magnified views of the red boxed region. The red arrow indicates lower epidermal cells. Bar = 100 μm. (g, h) Quantification analyses of cell number (g) and spikelet perimeter (h) of palea and lemma in ZH11 and gs3/gw8/gs9#1, Bars indicate SEM (n = 3). Asterisks indicate significant differences (**P < 0.01) between ZH11 and gs3/gw8/gs9#1 by two‐tailed Student's t‐test. Data are shown as means ± SEM.
