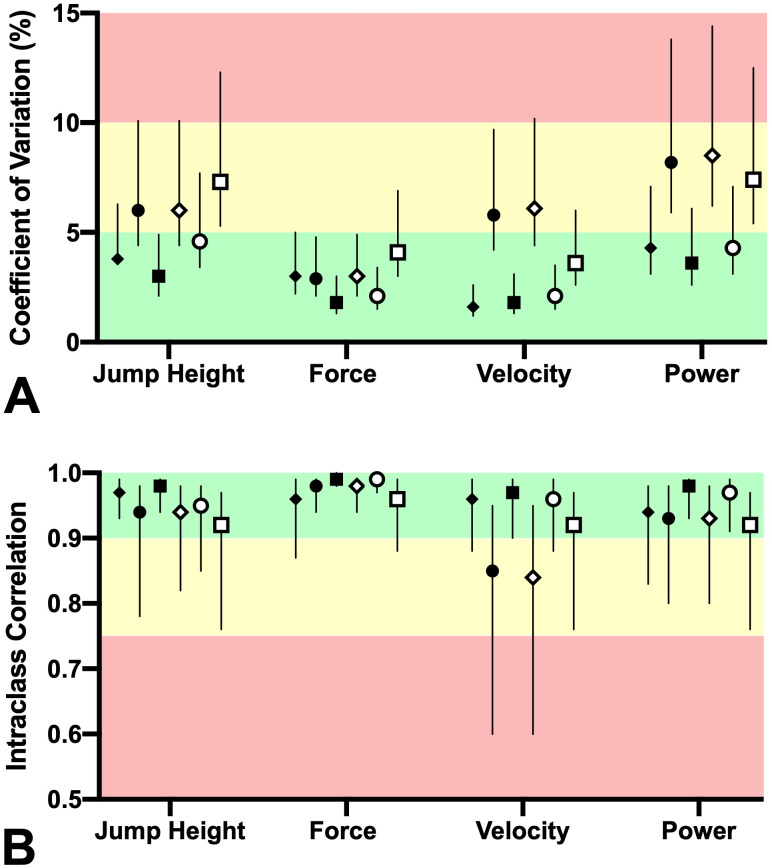
Figure 3. Intra-rater reliability of measures obtained during the countermovement (black symbols) and squat jumps (white symbols).
Force plate (⧫ ◊), JumpO 2 (•∘), and MyJump 2 (■ □) were used to measure these variables. Mean (symbol) with 90% CL (vertical lines) of (A) the coefficient of variations were interpreted as good (<5%, green), moderate (5% to 10%, yellow) and poor (>10%, red), while (B) intraclass correlation coefficient with 90% CL were interpreted as moderate (0.5 –0.75), good (0.75–0.90), and excellent (>0.90).

