

Abstract
In Robo3R3–5cKO mouse brain, rhombomere 3-derived trigeminal principal nucleus (PrV) neurons project bilaterally to the somatosensory thalamus. As a consequence, whisker-specific neural modules (barreloids and barrels) representing whiskers on both sides of the face develop in the sensory thalamus and the primary somatosensory cortex. We examined the morphological complexity of layer 4 barrel cells, their postsynaptic partners in layer 3, and functional specificity of layer 3 pyramidal cells.
Layer 4 spiny stellate cells form much smaller barrels and their dendritic fields are more focalized and less complex compared to controls, while layer 3 pyramidal cells did not show notable differences. Using in vivo 2-photon imaging of a genetically encoded fluorescent [Ca2+] sensor, we visualized neural activity in the normal and Robo3R3–5cKO barrel cortex in response to ipsi- and contralateral single whisker stimulation. Layer 3 neurons in control animals responded only to their contralateral whiskers, while in the mutant cortex layer 3 pyramidal neurons showed both ipsi- and contralateral whisker responses. These results indicate that bilateral whisker map inputs stimulate different but neighboring groups of layer 3 neurons which normally relay contralateral whisker-specific information to other cortical areas.
Keywords: barrel field, Ca2+-fluorescence protein, GCaMP, intrinsic optical imaging, in vivo, Robo3, somatosensory cortex, two-photon imaging, whiskers
INTRODUCTION
An essential feature of the sensory systems is the formation of a neural map of the sensory periphery with disproportionately larger areas devoted to areas with high density of sensory receptors in the periphery. A prominent example is the “whisker-barrel” tactile sensory system of nocturnal rodents. The precise array of the whiskers on the snout is represented with topographic precision first in the brainstem, next in the contralateral somatosensory thalamus and finally in the primary somatosensory cortex (reviewed in Erzurumlu et al., 2010; Erzurumlu and Gaspar 2012; Iwasato and Erzurumlu, 2018). These maps are relayed sequentially from the periphery to the brainstem and all the way to the neocortex during early postnatal development (Erzurumlu and Gaspar, 2012; 2020). During this process, several axon guidance molecules direct correct targeting, and midline crossing of trigeminal lemniscal axons between the brainstem and the thalamus (Iwasato and Erzurumlu, 2018). Defects or absence of such guidance cues result in abnormal sensory maps in the brain. Unlike the visual and auditory sensory systems, the tactile somatosensory system is a mostly crossed pathway similar to the main motor pathway, the corticospinal tract, in mammals. The right primary sensory cortex thus receives information from the left side of the body and the left primary sensory cortex from the right side of the body.
Developmental regulation of netrin and slit proteins and attracting/repulsing receptors (e.g., Deleted in Colorectal Cancer -DCC-, Roundabout -Robo-) on the axonal growth cones play an essential role in contralateralization of sensory and motor pathways (Chédotal, 2014; Kennedy et al., 1994; Kidd et al., 1998). Genetic and developmental defects in midline crossing have serious consequences, such as uncrossed or partially crossed descending motor tracts resulting in involuntary movements of the hands and forearm on one side of the body that mirror intentional movements on the opposite side (Méneret et al., 2015). Horizontal gaze palsy with progressive scoliosis (HGPPS), a human condition that results from mutations in the ROBO3 gene affecting hindbrain axon midline crossing in sensory-motor circuits (Jen et al., 2004). Altered nociceptive topognosis occurs in mice and in humans due to mutations in midline crossing gene DCC (da Silva et al., 2018). Humans with this mutation experience bilateral pain sensations following unilateral noxious stimulation (da Silva et al., 2018).
A notable fraction of trigeminal principal sensory (PrV) nucleus neurons are differentiated from rhombomere 3 (R3). In a conditional mouse mutant (the Robo3R3–5cKO mouse), these PrV neurons project ipsilaterally rather than contralaterally to the ventroposteromedial (VPM) nucleus of the thalamus (Renier et al., 2017). This bilateral trigeminal projection creates a nonoverlapping or nonconvergent map of the whiskers from both sides of the snout. The bilateral whisker “barreloid” map in the thalamus is then conveyed to the primary somatosensory cortex, which normally has a precise map of the distribution of whiskers on the contralateral snout (the barrels), resulting in an ipsilateral whisker distribution map nestled between the dorsal and ventral whisker representation barrels of the contralateral side (Figure 1). While the areal boundaries and the size of the primary somatosensory and even the whisker barrel area do not change, the whisker barrel area has twice the number of barrels, corresponding to the ipsilateral and contralateral whiskers (Renier et al., 2017). Consequently, the individual barrel sizes are smaller (Figure 1).
Figure 1.

Barrel cortex in control (A, C, E) and Robor3–5 cKO mice (B, D, F). A and B immunostained for VGlut2 (marker for TCAs, green) and NeuN (neurons, red). Insets show only NeuN immunostaining. Whisker barrel rows (a-e) are marked, in B asterisks outline the ipsilateral whisker representation area. In the same micrograph ipsilateral and contralateral c2 whisker barrels are indicated. C,D. Cytochrome oxidase (CO) staining reveals the barrel patterns in control (C) and knockout (D) mice. E, F. DAPI staining shows cellular barrel patterns. Scale bar in E = 500 μm.
In this study, we investigated the morphology and dendritic complexities of layer 4 spiny stellate cells, which form the barrels, and their primary targets the layer 3 pyramidal cells located superficial to them. These layer 3 pyramidal cells convey whisker sensory information to the motor and association areas of the same hemisphere and via the corpus callosum to the opposite hemisphere. We found that layer 4 spiny stellate neurons arranged into smaller barrels, showed more focalized dendritic orientation towards the barrel hollows and showed altered dendritic complexity. In contrast, layer 3 pyramidal neurons did not show notable changes in their dendritic complexity.
Next, we identified the ipsi- versus contralateral whisker barrels with whisker stimulation and intrinsic optical signal (IOS) imaging. We then used two-photon calcium imaging to investigate whether layer 3 pyramidal neurons receive unilateral whisker inputs or information from both contra- and ipsilateral whiskers. We identified numerous layer 3 pyramidal cells responding to ipsi- or contralateral whiskers. These results indicate that wiring and patterning of cortical circuits, at least in a primary sensory cortical region, are dependent on thalamocortical inputs and peripheral activity-dependent mechanisms.
MATERIALS AND METHODS
Animal breeding
We bred Robo3 conditional knockout mice (Robo3R3–5cKO) in our colony at the University of Maryland Baltimore, School of Medicine, in an Association for Assessment and Accreditation of Laboratory Animal Care-accredited laboratory facility. We obtained the original breeding pairs from Dr. A. Chédotal, Institut de la Vision, Paris, France (Renier et al., 2017; Tsytsarev et al., 2017). We previously detailed the generation of this mutant mouse line and whisker-related patterns, bilateral whisker maps in the thalamus and the primary somatosensory (S1) cortex (Renier et al., 2017). These mice are obtained by breeding Krox20cre mice with Robo3lox/lox mice. The Krox-20 gene encodes a zinc finger transcription factor required for the development of rhombomeres (r) 3 and 5 in the hindbrain (Wilkinson et al., 1989). The ventral part of the trigeminal principal sensory nucleus (PrV), which is responsible for transmitting whisker-related patterns to the contralateral thalamus where the whisker barreloids form, develops from rhombomere 3 (Oury et al., 2006). Robo3 (roundabout guidance receptor 3) encodes receptors that mediate repulsive actions of slit proteins, which are secreted along midline structures (Kidd et al., 1998). Thus, Robo3/Krox20 conditional knockout mice have midline crossing defects of PrV trigeminothalamic projections.
To determine the genotypes of the mice, we performed PCR from tail lysate DNA samples. As controls we used Robo3lox/lox and Krox20Cre; Robo3lox/ mice. All animal procedures were performed according to the regulations of the University of Maryland Baltimore School of Medicine Institutional Animal Care and Use Committee and the National Institute of Health Guide for the care and use of laboratory animals. We performed the chronic in vivo imaging experiments in the O’Connor Laboratory at the Johns Hopkins University School of Medicine. For those procedures, all animal handling was in accordance with the NIH Guide for the Care and Use of Laboratory Animals (NIH Publications No. 80–23) revised 1996 and a protocol approved by the John Hopkins University Animal Use and Care Committee.
Histological confirmation of the bilateral whisker maps in the somatosensory thalamus and cortex
We performed vesicular glutamate transporter 2 (VGlut-2) and neuronal nuclear protein (NeuN) immunocytochemistry to visualize the whisker-specific terminal patches of thalamocortical axons (TCAs, VGlut-2) and whisker-specific barrel patterning of layer 4 neurons (NeuN), and also 4′,6-diamidino-2-phenylindole (DAPI) fluorescent dye staining and cytochrome oxidase (CO) histochemistry in aldehyde-fixed brain sections (Figure 1). We removed the neocortex bilaterally from each brain and flattened them between glass slides. We sectioned flattened cortices at 100 μm thickness on a vibratome (Leica 1000S). After several rinses in phosphate buffer, we incubated the free-floating sections in antibody solutions at 4°C for 48 h. We used guinea pig polyclonal antibodies against VGlut-2 (Sigma SIG AB2251-I, 1:1000) mouse monoclonal NeuN (Chemicon MAB377, 1: 500). After rinses in PBS, we applied fluorescent secondary antibodies (FITC-conjugated donkey anti guinea pig, 1:250, and Cy3-conjugated Donkey anti mouse 1:250, from Jackson ImmunoResearch Laboratories) for 2 h. Afterward, we rinsed the sections in phosphate buffer several times and then mounted them onto glass slides and coverslipped them. Some sections we stained with DAPI to visualize cellular organization.For cytochrome oxidase (CO) histochemistry, we incubated free-floating flattened cortex sections in cytochrome C solution (5 mg diaminobenzidine, 5 mg cytochrome C, 0.4 g sucrose in 90 ml 0.1 mm Tris buffer, pH 7.6) on a rotator incubator for 12–24 h at 37°C, until the sections turned brown in color. We imaged the immunostained sections under epifluorescence and CO-stained sections under light field illumination and documented the whisker-specific patterning of the barrel cortex.
Golgi-Cox staining for dendritic analyses
Mice were killed and perfused with 0.9% NaCl. Brains were dissected and soaked in the Golgi-Cox filtrated solution (K2Cr2O7 35 mm, K2CrO4 43 mm, HgCl2 38 mm) for 2 weeks, rinsed in 30% sucrose for 1 week and sectioned at 200 μm with a cryostat (Leica M3050 S). Sections were mounted on slides, color reacted in 30% NH4OH for 30 min, and fixed in 30% AL4 Kodak photo fixative for 30 min.
We traced neurons using a drawing tube fitted onto a Nikon Labophot microscope with a 40X objective. We entered the tracings into Neurolucida 360 software (MBF bioscience, Williston, VT, USA) for cell morphology analysis. A total of 64 layer 4 spiny stellate cells from 9 control mice and 72 cells from 10 Robo3R3–5cKO mice were reconstructed. A total of 56 cells from 7 control mice and 80 cells from 10 Robo3R3–5cKO mice were reconstructed for the layer 3 pyramidal cells.
We assessed dendritic asymmetry of the layer 4 spiny stellate cells using Neurolucida 360. Neurons were considered as asymmetric (dendritic fields oriented) when 50% or more of the lines representing dendrites were oriented in a right angle sector of a 360° dendritic field. Otherwise, they were counted as symmetric (not oriented). The proportions between genotypes were tested with a χ2 test. Dendritic branching pattern was analyzed using two dimensional Sholl analysis (Sholl, 1953, Rodger et al., 2012) in Neurolucida 360, with concentric circles of 10μm increments starting from the soma.
Dendritic segments, bifurcation points, terminals, and soma size for both layer 4 spiny stellate cell and layer 3 pyramidal cell populations were analyzed using Neurolucida 360. One-way ANOVA was used for statistical analysis.
Photographic images were acquired with an Excelis™ MPX-20RC color camera attached to Nikon microscope. Photoshop software (Adobe) was used for image processing.
In vivo imaging experiments
In vivo experiments were performed in three Robo3R3–5cKO and two control (Robo3 heterozygotes) adult mice (weight 25–30 g, age 2–3 months, both male and female). During the initial surgery, a custom metal head plate was fixed to the skull using dental cement and the area above the somatosensory cortex was exposed following a circular craniotomy (4–5 mm diameter) above the primary somatosensory cortex (centered 3.5 mm lateral and 1.5 mm posterior from the lambda suture). We injected AAV GCaMP6s (adeno-associated virus (serotype 2/1, Syn.GCaMP6s.WPRE.SV40, University of Pennsylvania Gene Therapy Program Vector Core) into the left S1. Injections were made by glass micropipette at 4 – 6 sites (20–40 nl per site; depth, 150–250 μm). After virus injection, we covered the cranial window with two pieces of cover glass (Fisher; number 2 thickness) glued together. We fit the smaller cover glass over the craniotomy and glued the larger glass to the skull edge surrounding the craniotomy (Yang et al., 2016).
After recovery from surgery (1–2 weeks), animals were anesthetized with isoflurane (0.5%) in oxygen and rigidly fixed in a stereotaxic frame. For illumination, we used a monochromatic stabilized light source and the light passed through a 670 ± 30 nm filter. A CCD camera (QIClick, QImaging) was positioned above the recording area and directed such that its optical axis was perpendicular to the cortical surface and the focal plane was set to be 0.3 mm below the bone surface. The whisker to be stimulated was placed into a glass capillary attached to a piezoelectric bender (O’Connor et al., 2010). The intrinsic optical signal was calculated using the reflected illumination light as ΔR/R (%) with custom software written in MATLAB (R2007b, Mathworks). Maps of the ΔR/R response to trains of whisker stimulation were superimposed on the image of the cortical surface. The barrel column corresponding to the stimulated whisker was functionally localized with this method and used for the next series of experiments with 2-photon calcium imaging.
As described above, we identified the specific barrel column corresponding to the stimulated whisker within the cranial window by intrinsic signal imaging. 2-photon calcium imaging experiments were performed on a custom built two-photon microscope (http://openwiki.janelia.org/wiki/display/shareddesigns/MIMMS) equipped with a resonant scanning module (Thorlabs), GaAsP photomultiplier tube (Hamamatsu) and a 16×0.8 numerical aperture (NA) microscope objective (Nikon). Ti-Sapphire laser (Chameleon Ultra II, Coherent) was used for GCaMP6s 2-photon excitation at 1000 nm (40–60 mW at specimen). Imaging fields were restricted to the areas where GCaMP6s expression overlapped with the desired barrel column. We acquired images continuously at 30 Hz, within the field of view, which ranged from 670 μm × 700 μm to 440 μm × 485 μm (512 × 512 pixels). The recording trial, which contains 140 frames, was started every 4.5 s. We recorded from 650 neurons (mutant) and 414 neurons (control). Whisker deflections via the piezoelectric stimulator were synchronized to the recording acquisitions. The target C2 whisker on each side of face was inserted into a glass pipette attached to a piezo actuator (Piezo Systems), with 3–5 mm at the base exposed. The two sides received sinusoidal, rostrocaudal whisker deflection (0.5 s, 40 Hz, 1020 deg / s) in a randomly interleaved manner. Mice were anesthetized with light isoflurane (0.8–1.0%) during image acquisition. For each mouse, multiple fields of view (2–4 different depths of 100–230 μm from the pial surface, at the same lateral position). A line-by-line correction algorithm was used to correct for brain motion. Regions of interest (ROIs) corresponding to individual neurons were manually selected with the help of maximum intensity, ΔF/Fo was calculated from corrected fluorescence signal as (F−Fo)/Fo, where Fo was the mean F over 5 frames immediately preceding the time of stimulus onset for each trial. Evoked ΔF/Fo was calculated by averaging ΔF/Fo values over 5 frames following the time of stimulus onset for each trial.
To assign each neuron as ‘responsive’ or ‘nonresponsive’, evoked ΔF/F0 was calculated as above for each neuron, and a Wilcoxon signed rank test (for samples with absolute value skew <0.6) or a sign test (absolute value skew >0.6) was performed on the evoked ΔF/F0 values (Cite: Kwon et al., 2016). If the resulting P-value was <0.05, the neuron was considered responsive; otherwise it was nonresponsive.
Laterality index values for individual L2/3 neurons was calculated as the difference in evoked ΔF/Fo responses during ipsilateral and contralateral whisker deflection divided by their sum, i.e. (ipsi. − contra.) / (ipsi. + contra.). The statistical significance of laterality index was tested for individual neurons using two-tailed permutation test. We shuffled the neuronal responses across both ipsilateral and contralateral trials within each session for 20000 iterations, then calculated laterality index on the resampled data. If the laterality index value of a neuron fell outside the 95% of the resampled distribution, it was considered statistically significant.
RESULTS
Bilateral whisker-barrel fields.
As shown in Figure 1, barrels are more numerous (almost double the normal) in the Robo3R3–5cKO S1 cortex. Previously, Renier et al., (2017) measured the number and size of barrels in this conditional knockout mouse line. They found that there were ~35% more large barrels (corresponding to the 5 rows of large whiskers) (52 ± 2 vs. 33 ± 0) arranged in 8–10 rows rather than the usual 5 rows but their sizes were reduced, 0.04 mm2 ± 0.01 per barrel in mutants, compared with 0.09 mm2 ± 0.02 in controls. Our current results are in agreement (Figure 1), although we did not make the quantitative measurements. Also, Renier at al., (2017) performed selective denervation of ipsilateral versus contralateral whiskers or selective whisker row lesions and confirmed that the ipsilateral barrel map is a distinct, well-circumscribed area nestled in the middle of the contralateral barrel map, with a distinct septal border between the two maps.
We used VGlut2 immunostaining (a routine marker for TCA terminals) to visualize TCA terminal patterning, NeuN immunostaining to visualize neuronal patterning into barrels, DAPI staining for overall cellular patterning, and cytochrome oxidase (CO) histochemistry which is a marker for synapse and mitochondria-rich areas. All of these markers clearly show the bilateral whisker-barrel maps with numerous smaller size barrels (Figure 1). As reported before, the ipsi- and contralateral barrel maps are remarkably similar between animals, and the ipsilateral map nestled inside the contralateral map can be readily identified (Renier et al., 2017; Tsytsarev et al., 2017).
Dendritic field analyses, layer 4 and layers 2/3
During barrel formation, TCA terminals are the first elements to form whisker-specific patches in the developing S1 cortex and layer 4 spiny stellate cell dendrites orient towards these presynaptic patches and become polarized (reviewed in Erzurumlu and Gaspar, 2012; 2020). We used an established and classical approach, Golgi staining, to evaluate the dendritic organization of layer 4 neurons in the smaller but more numerous barrels of the adult male (n=36 cells from 5 mice) and female (n=36 cells from 5 mice) Robo3R3–5cKO and control (males, n=28 cells from 5 mice, females, n= 36 cells from 5 mice) mice. 64 cells from control mice and 72 cells from mutant mice were randomly selected for cell morphology analysis of layer 4 spiny stellate neurons. No differences were observed between the sexes of either genotype, therefore data presented here combine both male and female cell measurements.
After confirming cytoarchitecture, in particular organization of layer 4 neurons into barrels, we first analyzed their dendritic orientation to determine to what extent layer 4 spiny stellate cells focalized their dendrites into these smaller barrel hollows. We used Neurolucida 360 to determine dendritic orientation plots (Figure 2). Data from 36 female and 36 male barrel neurons from Robo3R3–5cKO and 36 female and 28 male neurons from control showed that 67.19% of control neurons have dendritic asymmetry (orientation) while 81.94% of mutant neurons display dendritic orientation (n=10 KO; n=9 control). Thus, in the smaller barrels of the mutant cortex, the dendritic trees of barrel neurons are more tightly bundled and oriented towards barrel hollows.
Figure 2.
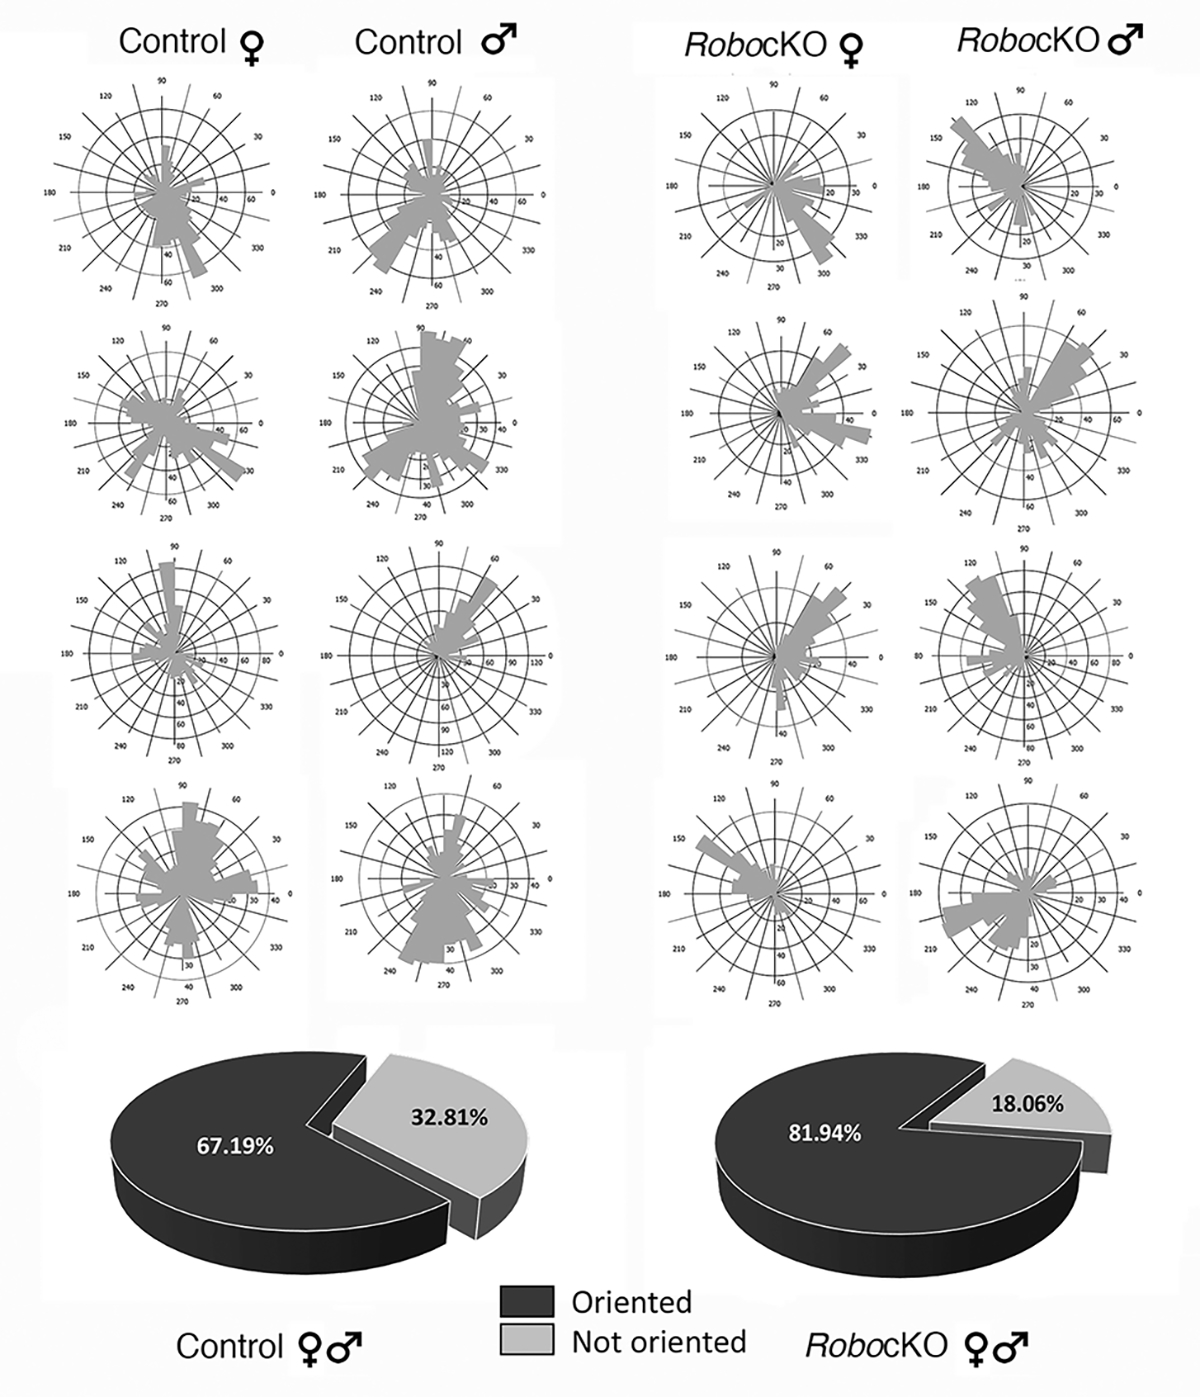
Dendritic orientation plots of representative cells from female and male control and Robo3cKO mice. Pie charts show the percentages of cells showing orientation in control and mutant animals. (Control, 67.19%; Mutant, 81.94%, black) versus cells that are not oriented (Control, 32.81%; Mutant, 18.06%, gray).
Methodical reconstruction and analysis of the dendritic complexity of layer 4 spiny stellate neurons using Neurolucida 360 revealed that dendritic arborization differed from controls in Robo3R3–5cKO barrel cortex (Fig. 3D–E). Other cell morphological parameters also appear to be affected in Robo3R3–5cKO (Fig. 3G–J), with a reduction in total dendritic length (Fig. 3G, *** p<0.001), a reduction in total terminals (Fig. 3H, *** p<0.001), and a reduction in soma size (Fig. 3I, * p<0.05). The number of dendritic branches per branch order was also affected in Robo3R3–5cKO (Fig. 3J; order 1 ns p>0.05; order 2 ***p<0.001; order 3 ***p<0.001; order 4 ***p<0.001). Taken together, these results show that dendritic complexity of layer 4 spiny stellate neurons in Robo3R3–5cKO is less elaborate compared to control mice. This is not surprising given the smaller size of the barrels.
Figure 3.

Layer 4 spiny stellate neuron dendritic morphology analysis. Panel A shows drawings of layer 4 spiny stellate neurons, left to right 2 female, 2 male cells and top row from control cases, bottom row Robo3R3–5cKO cases. B and C show images of 4 spiny stellate neurons, with B from a control mouse and C from a Robo3R3–5cKO mouse. Scale bar in B and C: 10μm. D represents the number of intersections per distance from the soma (Sholl) in μm; ns for 10, 150–170μm; **p<0.01 for 20, 140μm; ***p<0.001 for 30–130μm. E represents the number of nodes per distance from the soma in μm; p values are on the graph, *p<0.05. Dendritic length per distance from soma is shown in F; ns for 10, 150,160μm; *p<0.05 for 140μm; ***p<0.001 for 20–130μm. Whisker box plots show total dendritic length in G ( ***p<0.001), total terminals in H (***p<0.001), soma size in I (*p<0.05) and number of branches per branch order in J (order 1 ns p>0.05; order 2 ***p<0.001; order 3 ***p<0.001; order 4 3 ***p<0.001). In D-F, controls are shown in black and Robo3R3–5cKO mice are shown in light grey. In G-J, controls are shown in black and Robo3R3–5cKO mice are shown in white.
We also analyzed the dendritic complexity of layer 3 pyramidal neurons in Robo3R3–5cKO mice. Results showed that cell morphological parameters appear to be very similar in both Robo3R3–5cKO and controls (Fig. 4). Total dendritic length (Fig. 4E), total terminals (Fig. 4F), and soma size (Fig. 4G) were not significantly different in Robo3R3–5cKO cortex. Minimal differences were observed in dendritic arborization (Fig. 4C–D and 4H). Therefore, it appears that the mutation in Robo3R3–5cKO mice only affected layer 4 spiny stellate neurons.
Figure 4.

Layer 3 pyramidal neuron dendritic morphology analysis. Panel A shows drawings of pyramidal neurons, with 2 cells from control and 2 cells from Robo3R3–5cKO mice. B. Micrographs of Golgi stained cells. Scale bar: 25 μm. C, Number of intersections per distance from the soma (Sholl) in μm, ns for 10–60μm, 110–170μm, *p<0.05 for 70, 90, 100, 180, 190, 230–260μm; ***p<0.001 for 80 and 220μm. D represents dendritic length per distance from the soma, ns for 30–60μm, 130–210μm, *p<0.05 for 10, 20, 70, 100–120, 220–300μm; **p<0.01 for 80 and 90μm. E-H. Whisker box plots show total dendritic length, total terminals, soma size, and the number of branches per branch order. There were no significant differences for E, F and G. In H *p<0.05 for order 1, **p<0.01 for order 5.
In vivo imaging of layer 2/3 activity following ipsilateral and contralateral whisker stimulation
We used whisker stimulation-evoked intrinsic optical signal (IOS) imaging to define areas of activation in the barrel cortex of anesthetized control and mutant mice (Lenkov et al., 2013). After functionally localizing particular barrel columns by IOS (Figure 5), we used 2-photon Ca2+-imaging to acquire neuronal activity from layer 2/3 (100–230 μm depth from the pia mater) following single C2 whisker stimulation using a piezoelectric stimulus driver (control: n=2, 414 neurons; mutant: n=3, 650 neurons; 2–4 imaging depths for each animal) (Figure 6). We recorded calcium responses to the whisker stimulation from imaging fields that contained the IOS signals (Figure 5).
Figure 5.
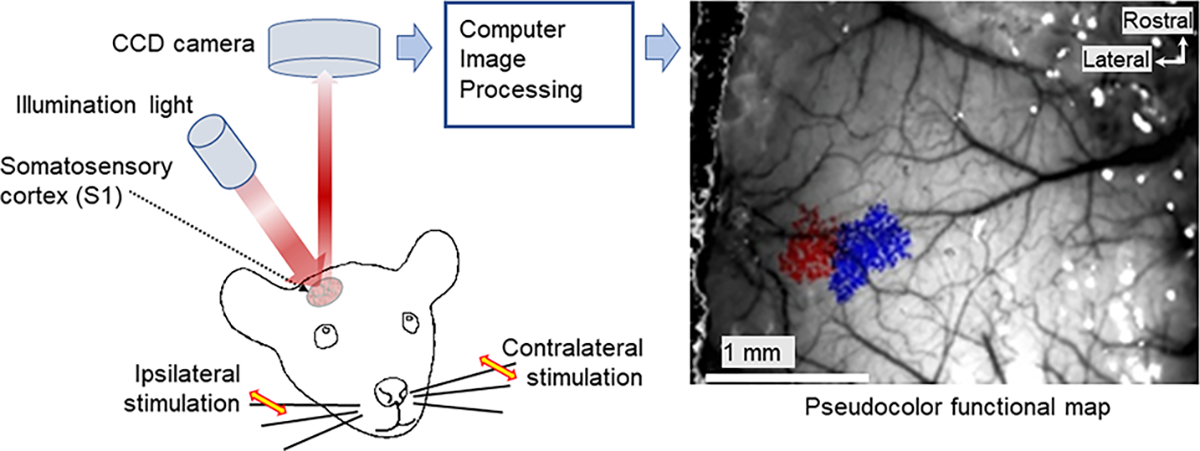
Left: intrinsic optical imaging experimental setup. Right: IOS data from a mutant animal; region of contralateral whisker responses shown in blue, ipsilateral in red.
Figure 6.

A. Maps of whisker-evoked fluorescence change in L2/3 neurons from representative control mice, obtained by 2-photon calcium imaging of S1 cortex barrel area during ipsi- or contralateral C2 whisker stimulation. Each dot depicts one neuron. The magnitude of evoked ΔF/Fo is indicated by the color bar. Scale bar: 100 μm. B. Same as panel A but for Robo3R3–5 cKO mice. C. Histograms showing distribution of laterality index values for neurons that show a statistically significant response to either whisker, combined across control animals. Light color bars indicate data from all responsive neurons, and dark color bars data from neurons with statistically significant laterality index. D. Same as panel C but for Robo3R3–5 cKO mice.
We stimulated the ipsi- and contralateral C2 whiskers in a randomly interleaved manner for both control and mutant mice, and imaged the area in which the representations of these whiskers were located. C2 - contralateral (normal) representation and C2 - ipsilateral (mutant) representation are in close proximity of one another (Figure 1). These barrels are close together and fall within the field of view used for 2-photon imaging (from 670 μm × 700 μm to 440 μm × 485 μm).
It is well-established that in normal mice, each large whisker on the snout has its specific barrel only in the contralateral S1 cortex and whisker-specific barrel neurons mainly establish excitatory glutamatergic synapses with the layers 2/3 neurons just above them. Layer 2/3 neurons in control animals responded robustly to the contralateral, but not ipsilateral, whisker stimulation (Figure 6). In contrast, in the mutant mice, both ipsi- and contralateral whisker-evoked responses appeared in cells located in different clusters, close to each other or partly overlapped (Figure 6).
To quantify the bias by which individual L2/3 neurons respond to ipsilateral versus contralateral whisker deflection, we calculated ‘laterality index’ (see Methods). The laterality index ranges between −1 and 1, indicating contralateral and ipsilateral bias respectively. We focused on those neurons that show a statistically significant response to deflection of either ipsilateral or contralateral whisker (control: 354 of 414 neurons; mutant: 347 of 650 neurons). We considered each neuron to be significantly ‘lateralized’ based on a two-tailed permutation test (see Methods). 51% of L2/3 neurons (179 of 354 neurons) in control and 33% (113 of 347 neurons) in mutant mice showed both statistically significant responsiveness and laterality index. In control mice, the vast majority of ‘responsive’ neurons showed contralateral bias as expected, and none of the responsive fraction showed ipsilateral bias (Figure 6C). In mutant mice, 36% and 64% of the responsive neurons (41 of 113 and 72 of 113 neurons) showed an ipsilateral and contralateral bias respectively (Figure 6D).
Discussion
The barrels comprise distinct patches of TCAs corresponding to single whiskers on the contralateral face (with preserved spatial organization), and a gathering of layer 4 spiny stellate cell bodies that encircle these patches and orient their dendrites towards these patches. Such asymmetric polarization of stellate cells around barrel walls has been noted since the original studies of T. Woolsey and H. van der Loos in the nineteen seventies (reviewed in Erzurumlu and Gaspar, 2021).
Contemporary studies have revealed that correlated activity and postsynaptic NMDA receptors are involved in partnering specific patches of TCA terminals with stellate cells (reviewed in Iwasato and Erzurumlu, 2018). In response to coordinated neural activity BTB/POZ domain-containing 3 (BTBD3) is translocated to the postsynaptic cell nucleus and orients the primary dendrites toward active axons in the barrel hollow (Matsui et al., 2013). The role of BTBD3 in dendritic orientation was also demonstrated by ectopically expressing it in the mouse or ferret visual cortex where there is normally no notable dendritic orientation in layer 4 (Matsui et al., 2013). More recent in vivo confocal imaging of postnatal mouse cortex across barrel development revealed that this process takes place in an activity- and NMDA receptor-dependent manner (Nakazawa et al., 2018; Iwasato, 2020; Mizuno et al., 2021).
In Robo3R3–5cKO mice, each S1 cortex face representation area is similar in size to control mice, but there are almost double the number of whisker barrels corresponding to all the whiskers on both snouts instead of the contralateral snout, and the main whisker barrels are smaller in size (Renier et al., 2017). Here, we found that layer 4 spiny stellate cell bodies are also positioned in rings around the barrel walls with their dendrites directed to the barrel hollows. In relation to the smaller barrel sizes, the Robo3R3–5cKO barrel cells had smaller but more focalized dendritic fields. This finding indicates that TCA terminal patch size and activity play a role in determining complexity and asymmetric focalization of layer 4 spiny stellate cells rather than intrinsic genetic programming of spiny stellate cells for dendritic arborization. In contrast, we did not see notable differences between the dendritic arbor extent and complexity of layer 3 pyramidal cells which receive inputs from the layer 4 barrel cells.
Layer 3 pyramidal cells, which receive excitatory glutamatergic synapses from the barrel cells, normally respond to only contralateral whiskers. In Robo3R3–5cKO barrel cortex, there were clusters of layer 3 pyramidal cells that responded to ipsi- and contralateral whiskers, indicating that layer 3 also has spatially distinct bilateral whisker maps. Unlike the convergence of monocular inputs onto layer 3 cells in the visual cortex, the bilateral whisker-barrel cortex layer 3 cells do not seem to receive convergent inputs from the ipsi- and contralateral whisker barrel cells. Primary sensory cortices in the mouse are remarkably similar in morphology yet there are disparity-selective binocular neurons in the visual cortex (Scholl et al., 2013) and binaural neurons in the auditory cortex (Panniello et al., 2018). The lack of bilateral whisker-sensitive layer 3 neurons in the Robo3R3–5cKO somatosensory cortex indicates that wiring mechanisms allowing convergence of bilateral visual or auditory inputs onto supragranular pyramidal neurons in the small binocular zone of the mouse visual cortex or auditory cortex are absent in the barrel cortex. This could be due to distinct segregation of ipsi- and contralateral barreloids in the thalamus and subsequently their terminals in the barrel cortex, a segregation imposed all the way to the supragranular layers. Feed-forward outputs to other cortical areas such as the primary motor, secondary somatosensory and various frontal and parietal association cortical areas, as well as the callosal projections, depart from layer 2/3. It would be quite informative to analyze how these corticocortical projections are affected and reflected in motor and cognitive behaviors through bilateral whisker information flow. An earlier study compared the sensorimotor behavioral repertoire of Robo3R3–5cKO mice to control mice and found that the mutant animals of both sexes showed deficits in whisker-dependent tests, such as Y-maze exploration, horizontal surface approach, bridge crossing, gap crossing, texture discrimination, floating in water, and whisking laterality (Tsytsarev et al., 2017). Our results indicate that bilateral whisker maps along the thalamocortical system do not offer a functional advantage. Instead, they lead to impairments, possibly due to the smaller size of the whisker-related modules and interference between the ipsilateral and contralateral whisker representations in the same thalamus and cortex. A “whisking-laterality” test was developed for these mutant mice. In this study mice had to walk across a bridge between two platforms spiked with thin rods on either side. The mice were tested under infrared light. Active, investigative whisking and any preference for whisking with the right or the left side of the snout with respect to the lateral position of the metal rods were quantified. Unexpectedly, the mutant mice would preferentially whisk over the ipsilaterally positioned rods with their contralateral snout, unlike controls which whisked with their ipsilateral snout. As a consequence, there may be dominance or preference to use the contralateral over the ipsilateral cortical whisker maps, and thus may change the weight of layer 3 synaptic inputs to the motor and association cortices.
Acknowledgements.
Research supported by NINDS R01NS84818 (RE) and R01NS089652 (DHO). We thank Dr. S. M. Bentzen and Ms. S. Holt, SOM. U. Maryland, for statistics consultations. RSE and DHO designed the experiments, analyzed results, wrote the paper. VT and SEK performed the in vivo imaging experiments, analyzed data, and participated in writing the paper. SZ performed immunohistochemical and histological staining, CP performed and analyzed morphological data and helped write the paper.
Contributor Information
Vassiliy Tsytsarev, Department of Anatomy and Neurobiology, University of Maryland School of Medicine, Baltimore 20 Penn St, HSF-2, 21201 MD, Baltimore, USA.
Sung E. Kwon, Department of Neuroscience, John Hopkins School of Medicine, 855 N. Wolfe Street, Rangos 295, Baltimore, MD 21205.
Celine Plachez, Department of Anatomy and Neurobiology, University of Maryland School of Medicine, Baltimore 20 Penn St, HSF-2, 21201 MD, Baltimore, USA
Shuxin Zhao, Department of Anatomy and Neurobiology, University of Maryland School of Medicine, Baltimore 20 Penn St, HSF-2, 21201 MD, Baltimore, USA.
Daniel H. O’Connor, Department of Neuroscience and Krieger Mind/Brain Institute, Johns Hopkins University, 3400 N Charles St, 338 Krieger Hall, Baltimore, MD 21218
Reha S. Erzurumlu, Department of Anatomy and Neurobiology, University of Maryland School of Medicine, 20 Penn st, HSF-2, 21201 MD, Baltimore, USA
References
- Chédotal A (2014) Development and plasticity of commissural circuits: from locomotion to brain repair. Trends Neurosci 37(10):551–62. [DOI] [PubMed] [Google Scholar]
- Da Silva RV, Johannssen H, Wyss ,MT, Roome RB, Bourojeni FB, Stifani N, Marsh APL, Ryan MM, et al. (2018) DCC is required for the development of nociceptive topognosis in Mice and Humans. Cell Rep 22(5): 1105–14. [DOI] [PubMed] [Google Scholar]
- Erzurumlu RS, Gaspar P (2012) Development and critical period plasticity of the barrel cortex. Eur J Neurosci 35(10):1540–53. [DOI] [PMC free article] [PubMed] [Google Scholar]
- Erzurumlu RS, Gaspar P (2020) how the barrel cortex became a working model for developmental plasticity: a historical perspective. J Neurosci 40(34):6460–6473. [DOI] [PMC free article] [PubMed] [Google Scholar]
- Erzurumlu RS, Murakami Y, Rijli FM (2010) Mapping the face in the somatosensory brainstem. Nat Rev Neurosci 11(4):252–63. [DOI] [PMC free article] [PubMed] [Google Scholar]
- Iwasato T (2020) In vivo imaging of neural circuit formation in the neonatal mouse barrel cortex. Dev Growth Differ 62(7–8):476–486. [DOI] [PubMed] [Google Scholar]
- Iwasato T, Erzurumlu RS (2018) Development of tactile sensory circuits in the CNS. Curr Opin Neurobiol 53:66–75. [DOI] [PMC free article] [PubMed] [Google Scholar]
- Jen JC, Chan WM, Bosley TM, Wan J, Carr JR, Rub U, Shattuck D, Salamon G, et al. (2004) Mutations in a human ROBO gene disrupt hindbrain axon pathway crossing and morphogenesis. Science 304(5676):1509–13 [DOI] [PMC free article] [PubMed] [Google Scholar]
- Kennedy TE, Serafini T, de la Torre JR, Tessier-Lavigne M (1994) Netrins are diffusible chemotropic factors for commissural axons in the embryonic spinal cord. Cell 78(3):425–35. [DOI] [PubMed] [Google Scholar]
- Kidd T, Brose K, Mitchell KJ, Fetter RD, Tessier-Lavigne M, Goodman CS, Tear G (1998) Roundabout controls axon crossing of the CNS midline and defines a novel subfamily of evolutionarily conserved guidance receptors. Cell 92(2):205–15. [DOI] [PubMed] [Google Scholar]
- Lenkov DN, Volnova AB, Pope AR, Tsytsarev V (2013) Advantages and limitations of brain imaging methods in the research of absence epilepsy in humans and animal models. J Neurosci Methods 212(2):195–202. [DOI] [PubMed] [Google Scholar]
- Matsui A, Tran M, Yoshida AC, Kikuchi SS, U M, Ogawa M, Shimogori T (2013) BTBD3 controls dendrite orientation toward active axons in mammalian neocortex. Science 342(6162):1114–8. [DOI] [PubMed] [Google Scholar]
- Méneret A, Trouillard O, Brochard V, Roze E (2015) Congenital mirror movements caused by a mutation in the DCC gene. Dev Med Child Neurol 57(8):776. [DOI] [PubMed] [Google Scholar]
- Mizuno H, Rao MS, Mizuno H, Sato T, Nakazawa S, Iwasato T (2021) NMDA Receptor Enhances Correlation of Spontaneous Activity in Neonatal Barrel Cortex. J Neurosci 41(6):1207–1217. [DOI] [PMC free article] [PubMed] [Google Scholar]
- Nakazawa S, Mizuno H, Iwasato T (2018) Differential dynamics of cortical neuron dendritic trees revealed by long-term in vivo imaging in neonates. Nat Commun 9(1):3106. [DOI] [PMC free article] [PubMed] [Google Scholar]
- O’Connor DH, Peron SP, Huber D, and Svoboda K (2010) Neural activity in barrel cortex underlying vibrissa-based object localization in mice. Neuron 67(6):1048–61. [DOI] [PubMed] [Google Scholar]
- Oury F, Murakami Y, Renaud JS, Pasqualetti M, Charnay P, Ren SY, Rijli FM (2006) Hoxa2- and rhombomere-dependent development of the mouse facial somatosensory map. Science 313(5792):1408–13. [DOI] [PubMed] [Google Scholar]
- Panniello M, King AJ, Dahmen JC, Walker MM (2018) Local and Global Spatial Organization of Interaural Level Difference and Frequency Preferences in Auditory Cortex. Cereb Cortex 28(1): 350–369. [DOI] [PMC free article] [PubMed] [Google Scholar]
- Renier N, Dominici C, Erzurumlu RS, Kratochwil CF, Rijli FM, Gaspar P, Chédotal A (2017) A mutant with bilateral whisker to barrel inputs unveils somatosensory mapping rules in the cerebral cortex. Elife 6:e23494. [DOI] [PMC free article] [PubMed] [Google Scholar]
- Rodger J, Drummond D, Hellstrom M, Robertson D, Harvey AR (2012) Long-term gene therapy causes transgene-specific changes in the morphology of regenerating retinal ganglion cells. PLoS One 7(2): e31061. [DOI] [PMC free article] [PubMed] [Google Scholar]
- Scholl B, Burge J, Priebe J (2013) Binocular integration and disparity selectivity in mouse primary visual cortex. J Neurophysiol. 109(12):3013–24. [DOI] [PMC free article] [PubMed] [Google Scholar]
- Sholl DA (1953) Dendritic organization in the neurons of the visual and motor cortices of the cat. J Anat 87(4):387–406. [PMC free article] [PubMed] [Google Scholar]
- Tsytsarev V, Arakawa H, Zhao S, Chédotal A, Erzurumlu RS (2017) Behavioral Consequences of a Bifacial Map in the Mouse Somatosensory Cortex. J. Neurosci 37(30):7209–7218. [DOI] [PMC free article] [PubMed] [Google Scholar]
- Wilkinson DG, Bhatt S, Chavrier P, Bravo R, Charnay P (1989) Segment-specific expression of a zinc-finger gene in the developing nervous system of the mouse. Nature 337(6206):461–4. [DOI] [PubMed] [Google Scholar]
- Yang H, Kwon SE, Severson KS, O’Connor DH (2016) Origins of choice-related activity in mouse somatosensory cortex. Nat. Neurosci 19(1):127–34. [DOI] [PMC free article] [PubMed] [Google Scholar]