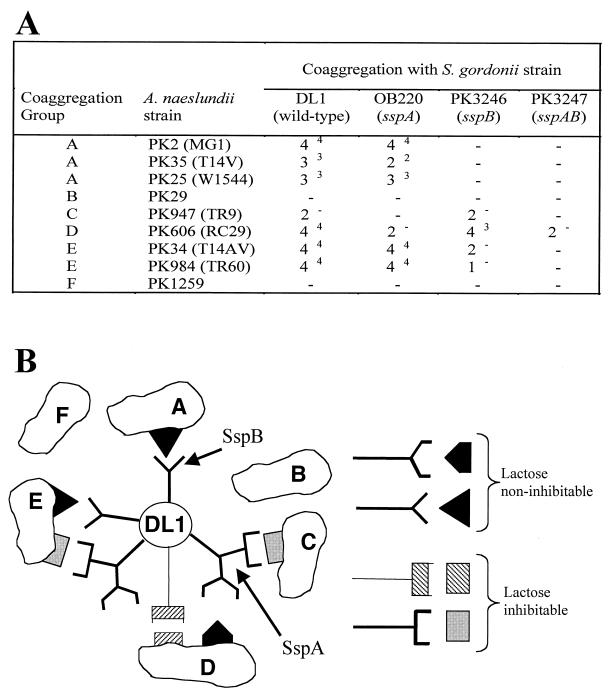
FIG. 3.
(A) Coaggregation of S. gordonii wild-type (DL1) and mutant strains with A. naeslundii strains and Actinomyces sp. strain WVA963 strain PK1259. Coaggregation group designations are shown at left. Coaggregation scores range from no coaggregation (−) to strongest coaggregation (4) (see text for details), in which large coaggregates settle out of suspension immediately, leaving a clear supernatant. Superscripts indicate the coaggregation score after addition of lactose. (B) Diagrammatic model of interactions of SspA and SspB with the six actinomyces coaggregation groups. At right, complementary sets of symbols used to represent interactions are depicted. The symbols with stems (left side) represent protein adhesins. Their cognates without stems (right side) represent receptors.

