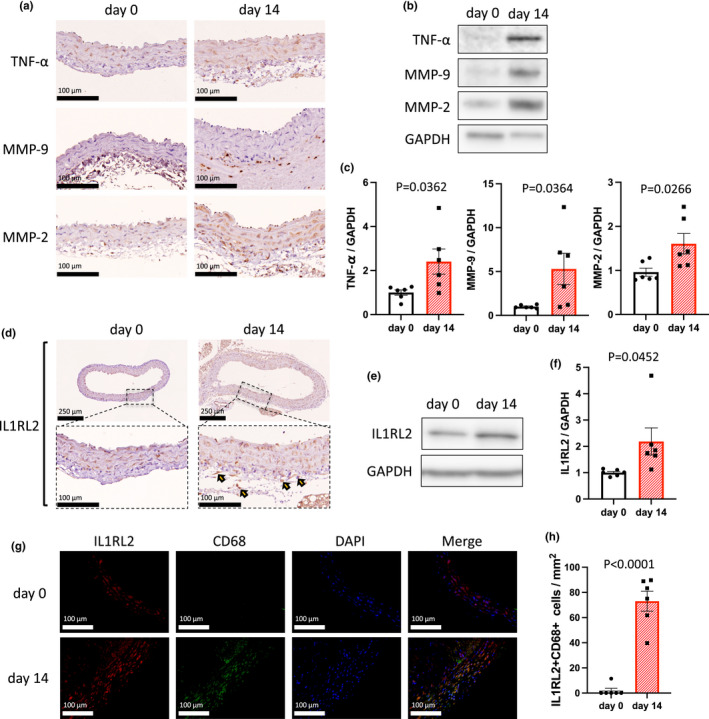
FIGURE 1.

IL1RL2+ macrophages accumulated in the mouse abdominal aortic wall after angiotensin II infusion. (a) Representative photomicrographs showing the abdominal aortic wall on days 0 and 14 stained with anti‐TNF‐α, anti‐MMP‐9, or anti‐MMP‐2 antibody. Scale bar, 100 μm. (b) Representative western blot analysis of TNF‐α, MMP‐9, MMP‐2, and GAPDH immunoreactivity in the abdominal aortic wall on days 0 and 14. (c) Bar graphs showing the relative densitometry of TNF‐α (n = 6, p = 0.0362 [t test], p = 0.0260 [Mann–Whitney U test]), MMP‐9 (n = 6, p = 0.0364 [t test], p = 0.0152 [Mann–Whitney U test]), and MMP‐2 (n = 6, p = 0.0266 [t test], p = 0.0260 [Mann–Whitney U test]). (d) Representative photomicrographs showing the abdominal aortic wall stained with anti‐IL1RL2 antibody on days 0 and 14. Arrowheads show representative IL1RL2+ cells. Scale bar, 100 μm. (e) Representative western blot analysis of IL1RL2 and GAPDH immunoactivity in the abdominal aortic wall on days 0 and 14. (f) Bar graph showing the relative densitometry of IL1RL2. n = 6, p = 0.0452 (t test), p = 0.0022 (Mann–Whitney U test). (g) Representative photomicrographs showing IL1RL2 (red) and CD68 (green) in aortic tissue on days 0 and 14. Scale bar, 100 μm. (h) Bar graph showing the number of IL1RL2+CD68+ cells in aortic tissue on days 0 and 14. n = 6, p < 0.0001 (t test), p = 0.0022 (Mann–Whitney U test).
