
Extended Data Fig. 2 |. Cryo-EM analysis of the CmWaaL–Fab complex.
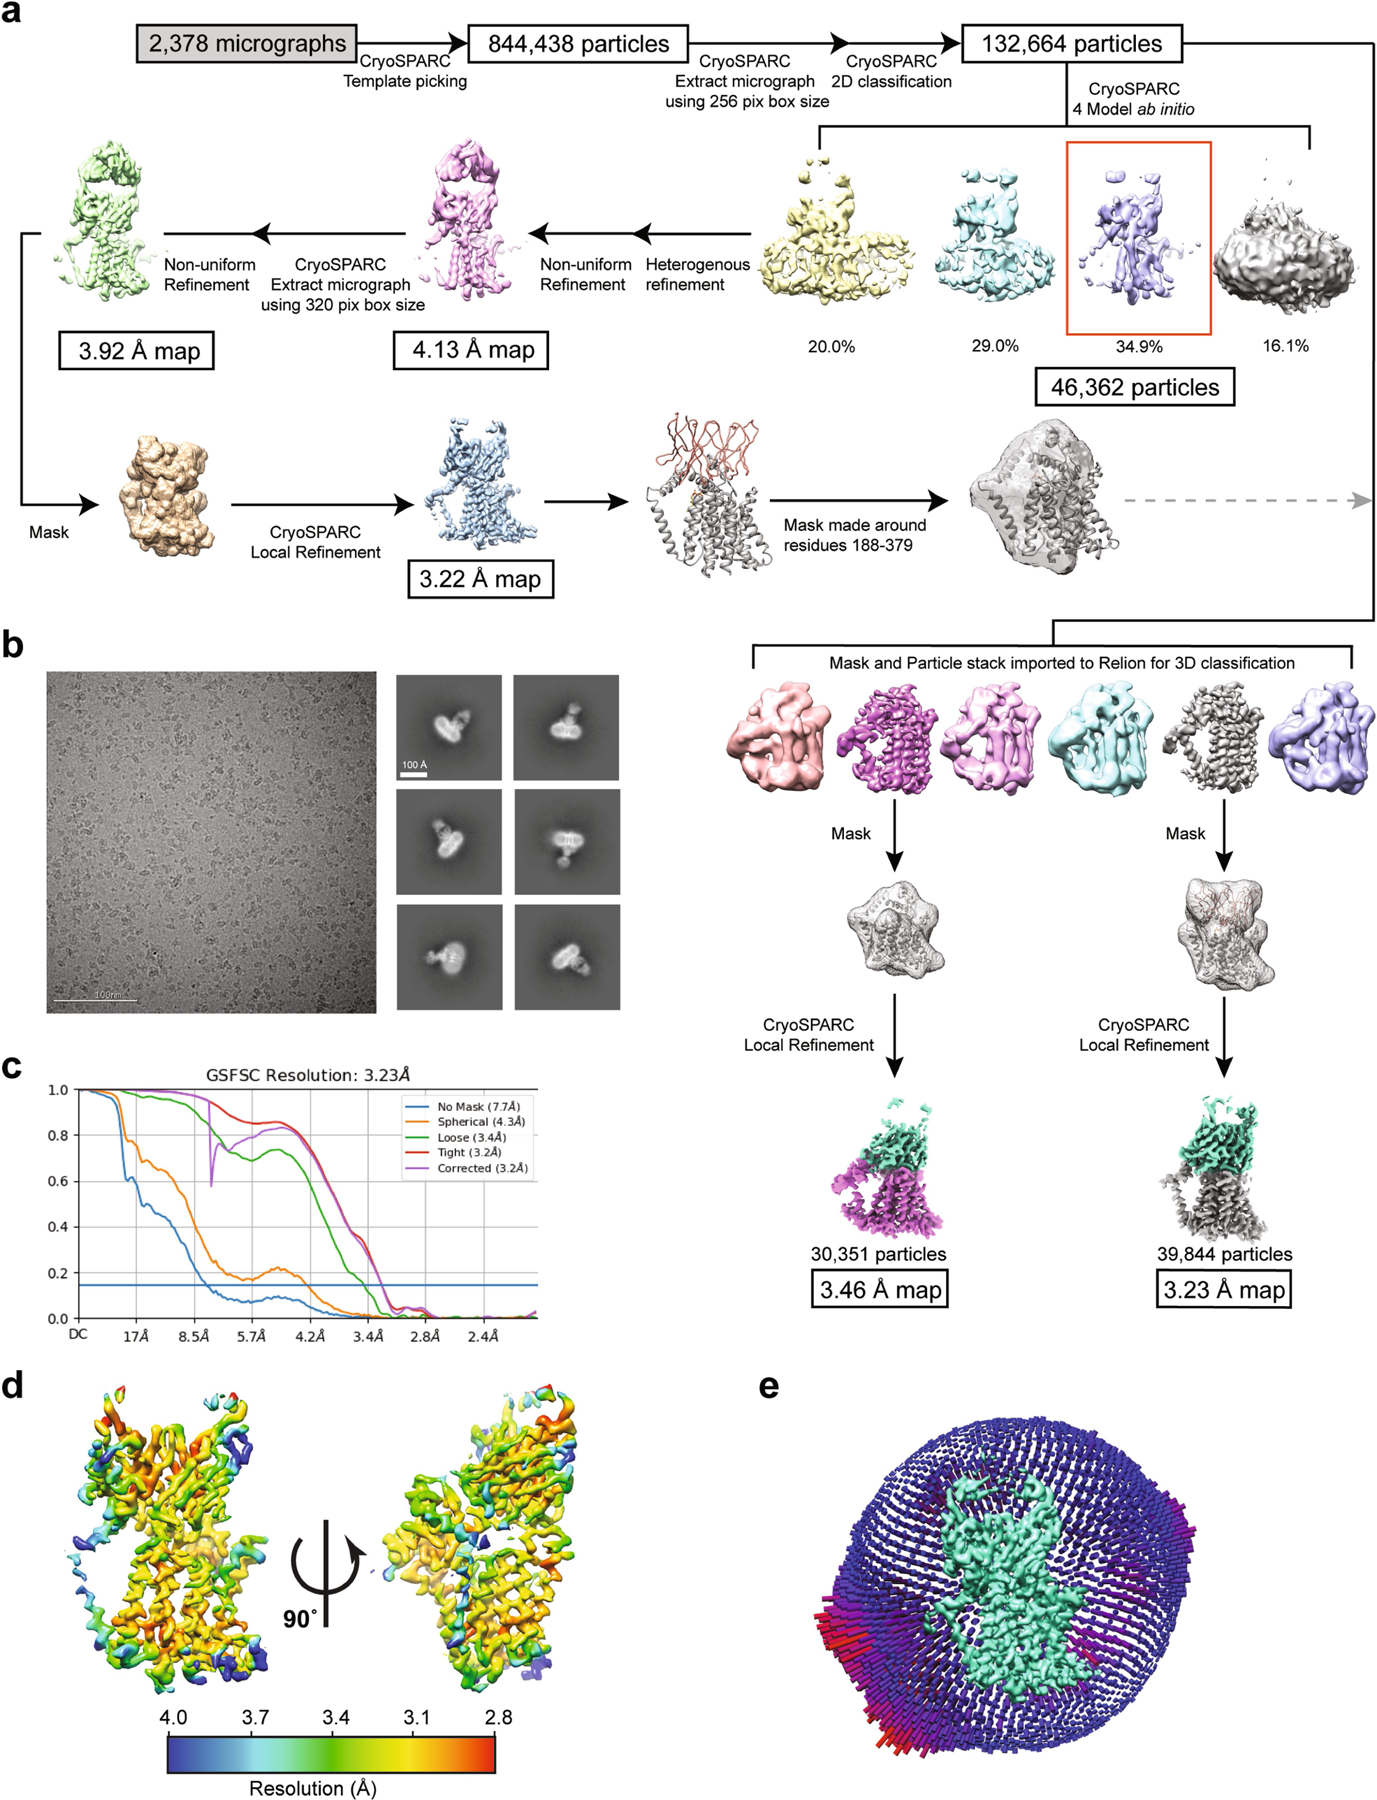
a, Flow chart outlining cryo-EM data processing and refinement performed to obtain a structure of a nanodisc-reconstituted CmWaaL with the Fab WaB10, both for the apo and the Und-PP-bound structures. b, On the left, representative micrograph (2.44 μm defocus). On right, representative two-dimensional class averages from CryoSPARC two-dimensional classification38,86. c, Fourier shell correlation (FSC) curves for the Und-PP-bound CmWaaL–Fab complex. d, Local resolution display of unsharpened reconstructions of Und-PP-bound CmWaaL in complex with the WaB10 Fab, in orthogonal views. e, Euler angle distribution of all Und-PP-bound particles used in the final map reconstruction. Final map shown in green. Each orientation is represented by a cylinder, with each cylinder’s height and colour (from blue to red) proportional to the number of particles for that specific direction.