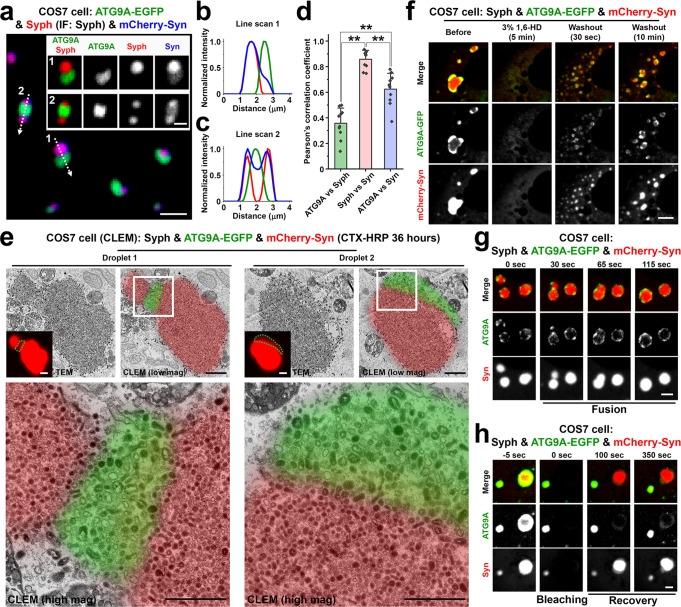
Fig. 4. Synaptophysin and ATG9A segregate in distinct vesicle clusters within the synapsin phase.
COS7 cells were triple co-transfected with synaptophysin (untagged), ATG9A-EGFP and mCherry-synapsin. a–c Representative confocal image (a), and corresponding line-scan analysis of the droplets (b, c) showing that synapsin phases include two distinct subphases containing synaptophysin and ATG9A-EGFP, respectively. Synaptophysin was visualized by immunofluorescence. The intensity of the mCherry-synapsin fluorescence is more intense on the synaptophysin phase, as quantified in d. d The colocalization of the pairs of proteins indicated was calculated by Pearson’s coefficients. Values are means ± SD. **p < 0.01 by one-way ANOVA with Tukey’s HSD post hoc test (droplets in 10 different cells were analyzed). e Synaptophysin, ATG9A-EGFP and mCherry-synapsin co-expressing COS7 cells were incubated with 10 μg/ml cholera toxin conjugated HRP (CTX-HRP) for 36 h and then fixed for correlative light-electron microscopy (CLEM). Green dotted lines in the insets indicate ATG9A-EGFP-positive regions in mCherry-synapsin condensates. Note that synaptophysin and ATG9A vesicles have slightly different sizes. f–h Dynamics of the ATG9A, synaptophysin and synapsin droplets: f Reversible dispersion by 1,6-Hexanediol treatment. See also Supplementary Video 4; g fusion; h Fluorescence recovery after photobleaching. Source data are provided as a Source Data file. Scale bars, a = 2 μm (1 μm for insets), e = 1 μm (low mag and inset) or 500 nm (high mag), f = 5 μm, g and h = 2 μm. p-values (d): 0 [(ATG9A vs. Syph) vs. (Syph vs. Syn)], 2.009 × 10‒5 [(ATG9A vs. Syph) vs. (ATG9A vs. Syn)], 1.270 × 10‒4 [(Syph vs. Syn) vs. (ATG9A vs. Syn)].

