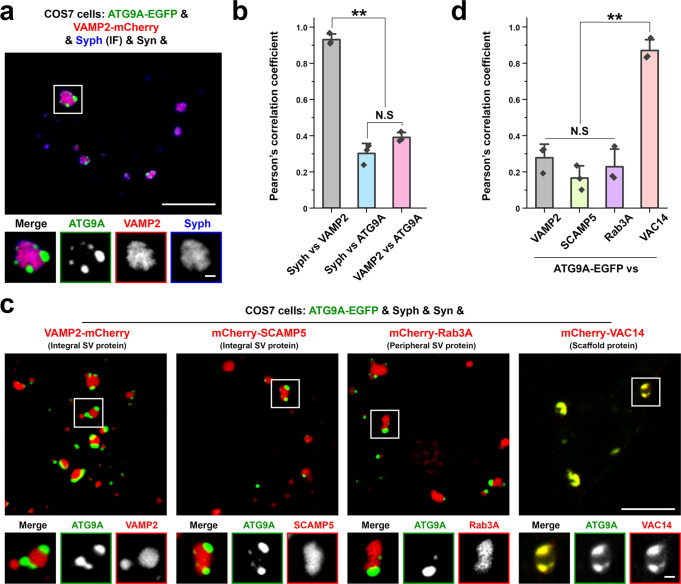
Fig. 6. Validation of the proteomic analysis of ATG9A and synaptophysin vesicles.
a Segregation of VAMP2-mCherry from ATG9A-EGFP in COS7 cells also expressing synapsin and synaptophysin. Synaptophysin was visualized by immunofluorescence. b The colocalization of the pairs of proteins indicated was calculated by Pearson’s coefficients. Values are means ± SD; N.S., not significant; **p < 0.01 by one-way ANOVA with Tukey’s HSD post hoc test (droplets in 3 different cells were analyzed). c ATG9A is segregated from SV proteins (VAMP2, SCAMP5, Rab3A) but precisely colocalizes with VAC14 in COS7 cells also expressing synaptophysin and synapsin, consistent with proteomics data. d The colocalization of the pairs of proteins indicated was calculated by Pearson’s coefficients. Values are means ± SD; N.S., not significant; **p < 0.01 by one-way ANOVA with Tukey’s HSD post hoc test (droplets in 3 different cells for each condition were analyzed). Source data are provided as a Source Data file. Scale bars, a and c = 10 μm (1 μm for high-magnification images). p-values (b): 3.032 × 10‒6 [(Syph vs. VAMP2) vs. (Syph vs. ATG9A)], 7.549 × 10‒6 [(Syph vs. VAMP2) vs. (VAMP2 vs. ATG9A)], 0.07488 [(Syph vs. ATG9A) vs. (VAMP2 vs. ATG9A)]. d 0.3406 (VAMP2 vs. SCAMP5), 0.8552 (VAMP2 vs. Rab3), 5.655 × 10‒5 (VAMP2 vs. VAC14), 0.7519 (SCAMP5 vs. Rab3A), 1.546 × 10‒5 (SCAMP5 vs. VAC14), 3.116 × 10‒5 (Rab3A vs. VAC14).

