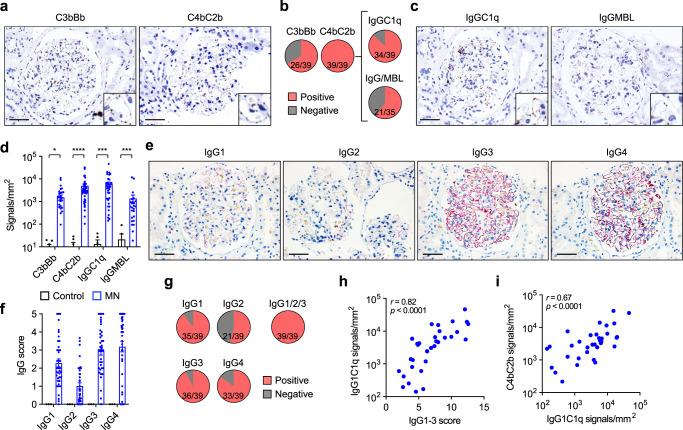
Fig. 2. Complement is dominantly activated via the classical pathway in patients with MN.
a Representative images of proximity ligation assays showing the alternative convertase C3bBb (left) and the classical/lectin convertase C4bC2b (right) performed on biopsies from patients with MN (n = 39). Bars 50 µm. b Detection of C3bBb, C4bC2b and IgGC1q using proximity ligation assays as well as of MBL/IgG in immunofluorescence and proximity ligation assay. c Representative images of proximity ligation assays showing the assembly of IgGC1q (left) and IgGMBL (right) performed on biopsies from patients with MN (n = 39 and n = 26 for IgGC1q and IgGMBL, respectively). Bars 50 µm. d Quantitative analysis of proximity ligation assay signals in biopsies from patients with MN and time point zero biopsies from renal transplant recipients. Data are presented as mean and SEM. C3bBb, *p = 0.0442; C4bC2b, ****p < 0.0001; IgGC1q, ***p = 0.0005; IgGMBL, ***p = 0.0003 (two-tailed Mann–Whitney test). e Representative immunohistochemical stainings for the IgG subclasses IgG1, IgG2, IgG3, and IgG4 in a biopsy sample from a patient with MN (n = 39). Bars 50 µm. f Quantitative analysis (histological score) of IgG subclass signals in 39 biopsies from patients with MN and 3 time point zero biopsies from renal transplant recipients. Data are presented as mean and SEM. g Detection of IgG1, IgG2, IgG3, and IgG4 as well as at least one of the C1q-binding subclasses IgG1, IgG2, or IgG3 in biopsies from patients with MN. h, i Correlation of the cumulative IgG1-3 score with IgGC1q proximity ligation assay signals (h) and IgGC1q signals with the C4bC2b signals (i). Spearman’s r correlation coefficient (two-tailed).

