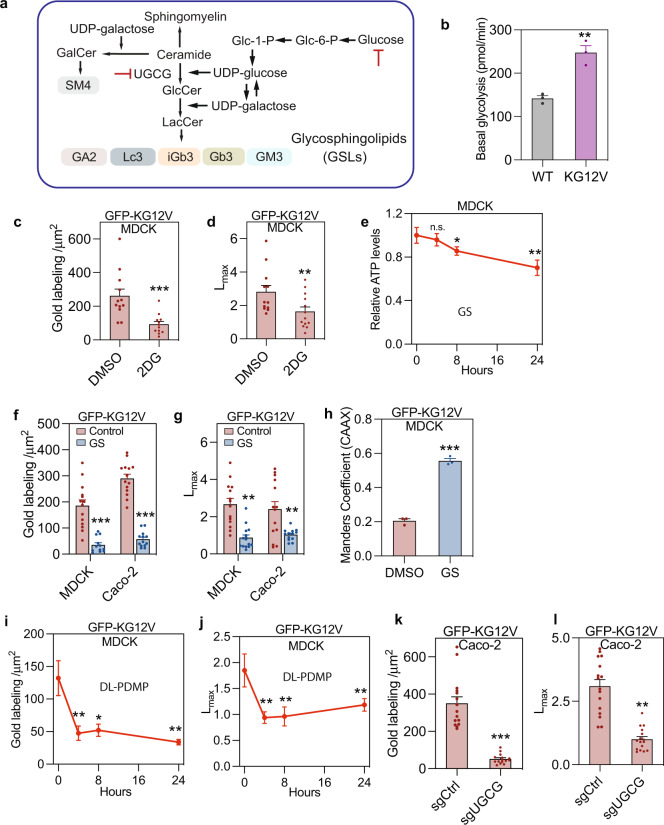
Fig. 1. Suppressing glycolysis mislocalizes KRASG12V from the plasma membrane.
a Diagram of GSL synthetic pathways. UGCG, UDP-glucose ceramide glucosyltransferase. b Basal glycolysis rate of WT and KRASG12V (KG12V) expressing MDCK cells measured in a Seahorse XF analyzer (±SEM, n = 3 independent biological relicates, **p < 0.01). Time course of changes in 2DG (10 mM)-treated MDCK cells of: GFP-KRASG12V (KG12V) PM binding quantified by EM as mean gold labeling density (c), and nanoclustering quantified as Lmax (d) (n = 12 PM sheets for each group). For the DMSO control time course see Fig. S1J–L. Time course of changes in relative ATP levels for control (t = 0) and glucose-depleted (GS) MDCK-KRASG12V cells (±SD, n = 3 wells, *p < 0.05, **p < 0.01) (e). PM localization (f) and nanoclustering (g) of KRASG12V-expressing MDCK (n = 14 for Control, n = 12 for GS) or Caco-2 cells, evaluated by EM, after 4 h of glucose depletion (n = 14 for Control, n = 13 for GS). Time course of GFP-KRASG12V mislocalization in glucose-depleted MDCK cells co-expressing mCherry-CAAX (an endomembrane marker) evaluated using Manders coefficients (±SD, n = 3 independent replicates, ***p < 0.001) (h). Time course of changes in PM binding (i) and nanoclustering (j) of GFP-KRASG12V in DL-PDMP-treated MDCK cells. EM evaluation of PM binding (k) and nanoclustering (l) of GFP-KRASG12V in UGCG knockdown (sgUGCG) and non-targeting control (sgCtrl) Caco-2 cells (n = 41 PM sheets). In (c, d), (f, g), and (i–l) data are mean ± SEM. Differences in gold labeling densities and Lmax were evaluated in two-tailed Student’s t-tests and bootstrap tests respectively (*p < 0.05, **p < 0.01, ***p < 0.001). Exact p-values and source data are provided as a Source data file.

