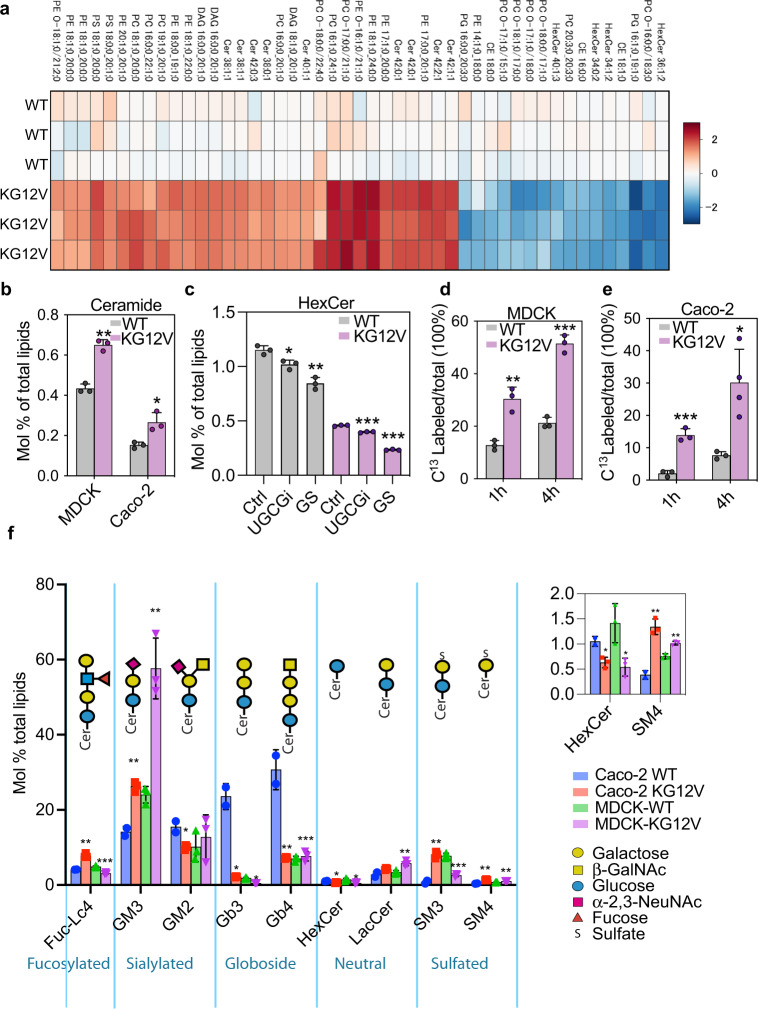
Fig. 3. KRASG12V expression reprograms the cellular lipidome.
Lipidomic analysis of parental (WT) versus GFP-KRASG12V-expressing MDCK, or Caco-2 cells: a Heatmap of MDCK lipid species that changed most upon KRASG12V expression, shown as log2 fold changes (red = increase, blue = decrease). b Molar fractions of ceramide from lipidomic analyses in (a). c HexCer levels shown as mean mol% in glucose depleted (GS), or DL-PDMP-treated (UGCGi) WT and KRASG12V-expressing MDCK cells. HexCer includes GlcCer and GalCer, which cannot be distinguished by MS unless radiolabeled. d, e Fraction of newly synthesized HexCer (=GlcCer) in WT and KRASG12V-expressing MDCK and Caco-2 cells following 1 h and 4 h metabolic labeling with [U-13C6]-glucose. f Relative abundance of GSLs shown as mol% in WT and KRASG12V-expressing MDCK and Caco-2 cells. Inset shows an enlarged portion of the main graph. Data are means ± SEM. (a–e) are all mean ± SD; from n = 3 biological replicates; differences were evaluated using two-tailed Student’s t-tests (*p < 0.05, **p < 0.01,***p < 0.001).

