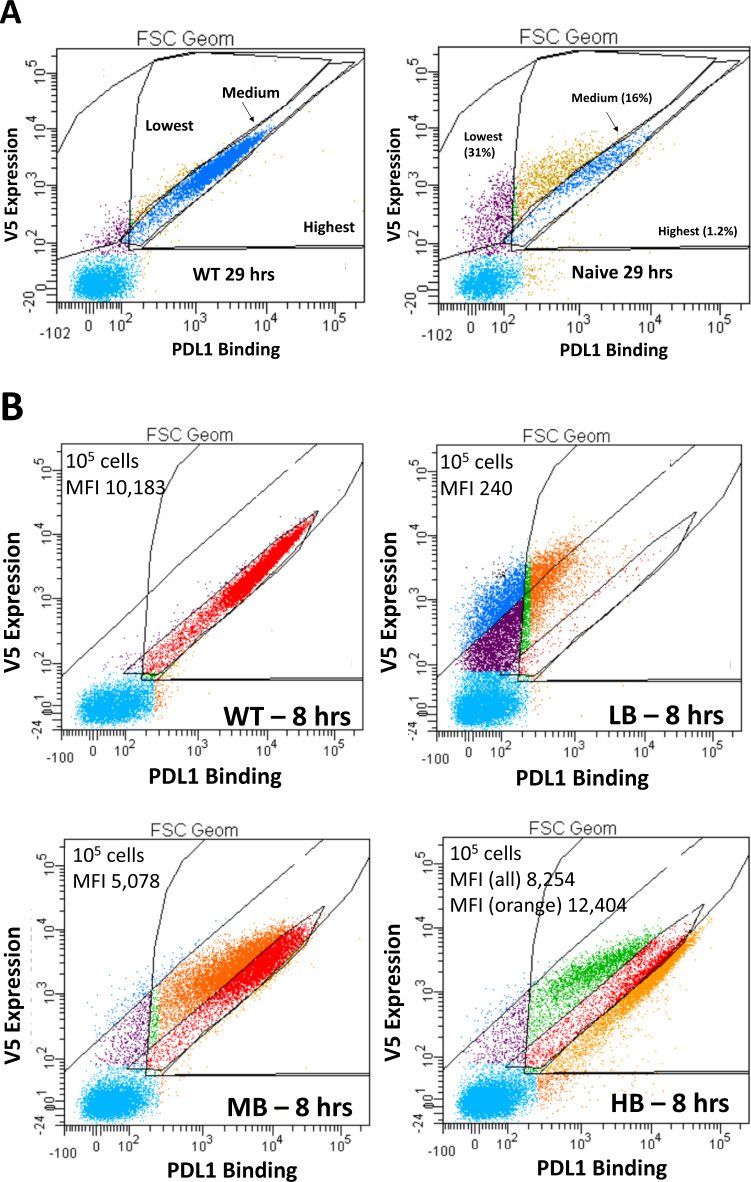
Fig. 2. Library sorting by FACS.
Sorting of the naive library by FACS and quality assessment of each enriched group by flow cytometry. A Sorting of the naive Atezolizumab scFv library on the yeast surface compared to the WT scFv (after 29 h of off-rate competition). The right (highest) gate was set to collect mutants with slower off-rates while the middle (medium (blue cells)) gate was set for WT-level off-rates and the left (lowest (purple)) gate set for faster off-rates. The y-axis represents scFv expression (measured by the level of V5 epitope/AF647) while the x-axis is PD-L1 binding/PE intensity. % values represent each group’s percent of the total number of sorted cells. B Testing each sorted population for binding intensity relative to the WT after 8 h of off-rate competition. LB are low-binders (faster off-rates), MB are medium binders (WT off-rates), HB are high binders (slower off-rates). Analyzed 105 cells per group, mean fluorescent intensity (MFI) on the x-axis is given per plot, V5 expression (y-axis) from AF647 intensity while binding (x-axis) in PE intensity.

