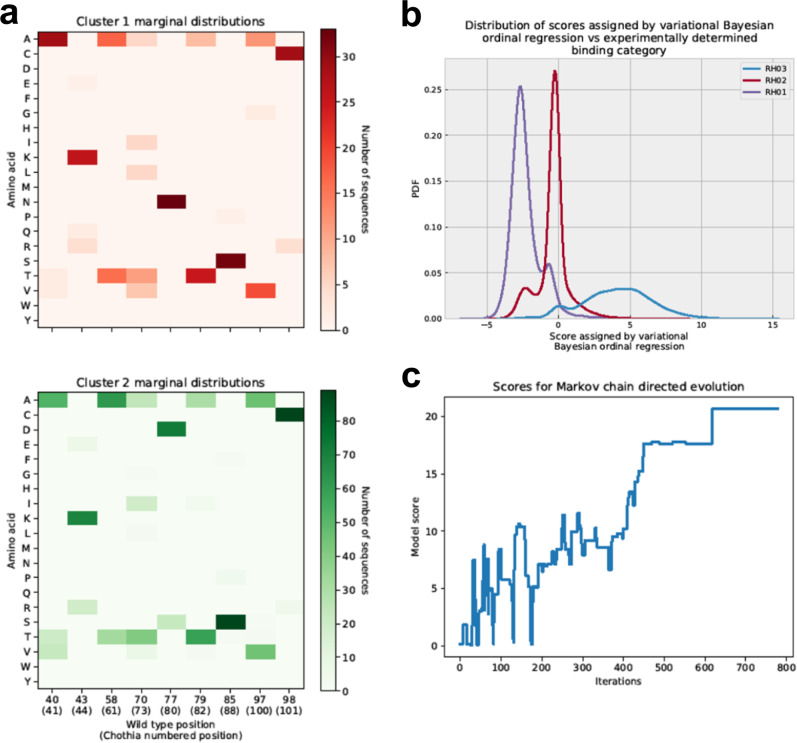
Fig. 6. Analysis of pipeline results.
a The per-position marginal distributions in the two main clusters. Each main cluster has several subclusters as apparent from the marginal distribution. Only positions mutated in either cluster are displayed. Each position is numbered first using numbering from the wild-type sequence and then in parenthesis using Chothia numbering. b illustrates the distribution of scores assigned to sequences in each binding category by the variational Bayesian model, which is designed to perform ordinal regression (classification on ranked categories). The experimental data does not directly measure off-rates but rather classifies sequences into three bins: RH01 (high off rate), RH02 (moderate off rate), RH03 (low off rate). The higher the score assigned by the ordinal regression model, the more confident the model that the sequence has a low off rate, while lower scores indicate greater confidence in a high off rate. c The accepted scores vs iteration for a typical simulated annealing chain. The algorithm initially explores sequence space impartially and as the temperature is reduced is gradually forced to focus on the most promising regions it has found thus far. Source data are provided as a source data file for all panels.

