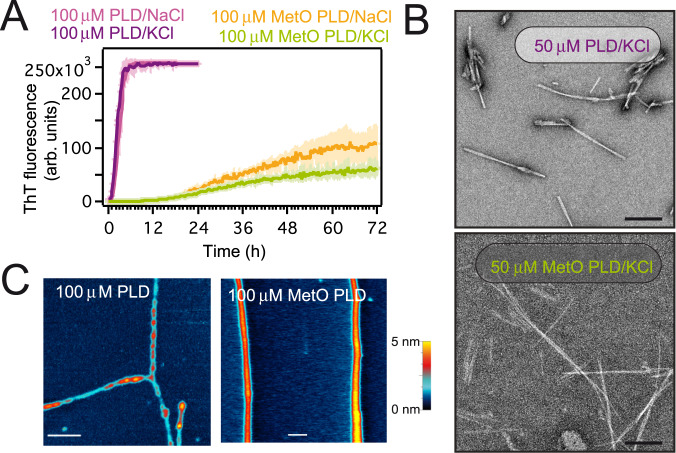
Fig. 2. MetO PLD forms distinct fibrillar aggregates.
A Amyloid aggregation kinetics as measured by ThT fluorescence. Samples contained either 150 mM KCl or 150 mM NaCl, as noted. B Representative electron micrographs showing fibrils formed by 50 μM PLD and MetO PLD aged for 20 days. Scale bars correspond to 200 nm. C Atomic force microscopy topographic characterization of the fibrils formed by 100 μM PLD (left) and 100 μM MetO PLD (right) samples aged for 4 months. PLD fibrils show variable diameters along their length. Scale bars correspond to 400 nm. Heat-color height scale is 5 nm. Samples in B and C contained 150 mM KCl.

