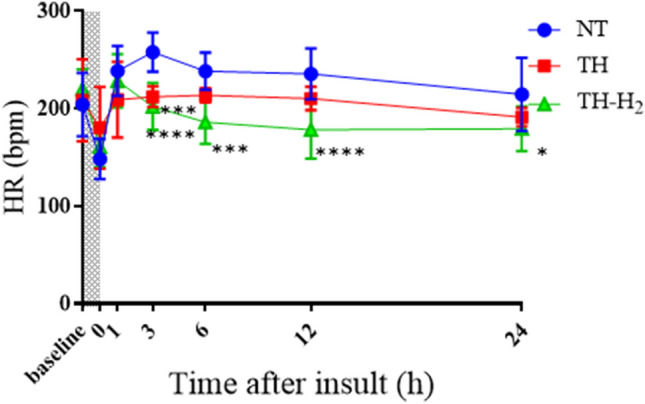
Figure 3.

Heart rate (bpm) at the end and at 1, 3, 6, 12, and 24 h after hypoxic-ischemic insult in normothermia (NT, n = 10), therapeutic hypothermia (TH, n = 8), and TH with hydrogen gas inhalation (TH + H2, n = 8) groups. Shaded areas indicate the hypoxic-ischemic insult period. Data are means ± SD in the NT group (blue circle), TH group (red square), and TH + H2 gas group (green triangle). *p < 0.05, **p < 0.01, ***p < 0.001, ****p < 0.0001 vs. the NT group.
