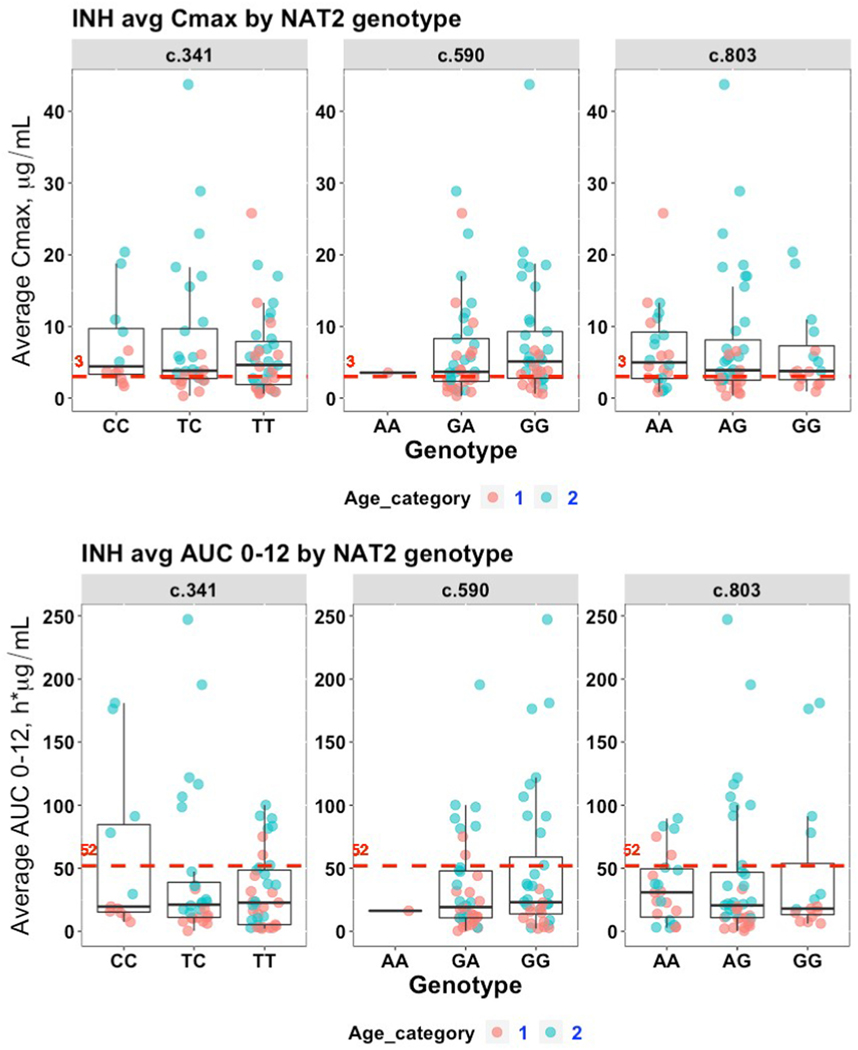
Fig. 1. INH exposure analyzed by genotypes at three NAT2 loci.
Available average Cmax (μg/mL) and average AUC0–12 (h*μg/mL) values were analyzed by genotype at each of three NAT2 SNP loci. Each marker represents an individual participant. Those having a non-mature NAT2 phenotype as measured by age less than 5.3 years of age (“Age Category 1”) represented by red markers and blue markers representing individuals 5.3 years of age or older (“Age Category 2”). A) Cmax; B) AUC0–12. The red, dashed line in each subplot represents the target expected exposure level for adult patients.

